Pipeline Velocity Calculation for B2B Revenue Teams
Leaders gain a single metric that predicts revenue better than pipeline size alone.

Pipeline velocity calculation gives B2B revenue teams a way to find where revenue is slowing. Its value comes from reading four variables together, namely qualified opportunities, deal size, win rate, and sales cycle length. Consider which lever explains the result and what moving that lever would do to the other three.
Why pipeline velocity belongs on the leadership dashboard — and pipeline volume does not
The quarter ends below target despite “healthy” pipeline coverage. The CRM looked reassuring, but the deals inside it were slow, poorly qualified, or larger on paper than at close. Coverage offered comfort without explaining conversion. That is the failure of pipeline volume as a north-star metric, because it records how much deal value sits in the funnel while leaving its likelihood and timing largely out of view.
A team can set a record for MQLs and build a large pipeline yet bring in less revenue per day than a smaller pipeline whose deals move faster. Falling win rates and longer cycles explain the apparent contradiction. Counting its contents without asking how they move is rather like judging traffic by how many cars fit on the road.
Salesmotion’s 2025 analysis frames pipeline velocity as a leading indicator of future revenue, in contrast with trailing metrics such as quarterly sales. How fast is the pipeline actually converting? Expressing revenue as a rate makes that question harder to dodge with another impressive pipeline total.
The pipeline velocity formula and what its output actually means
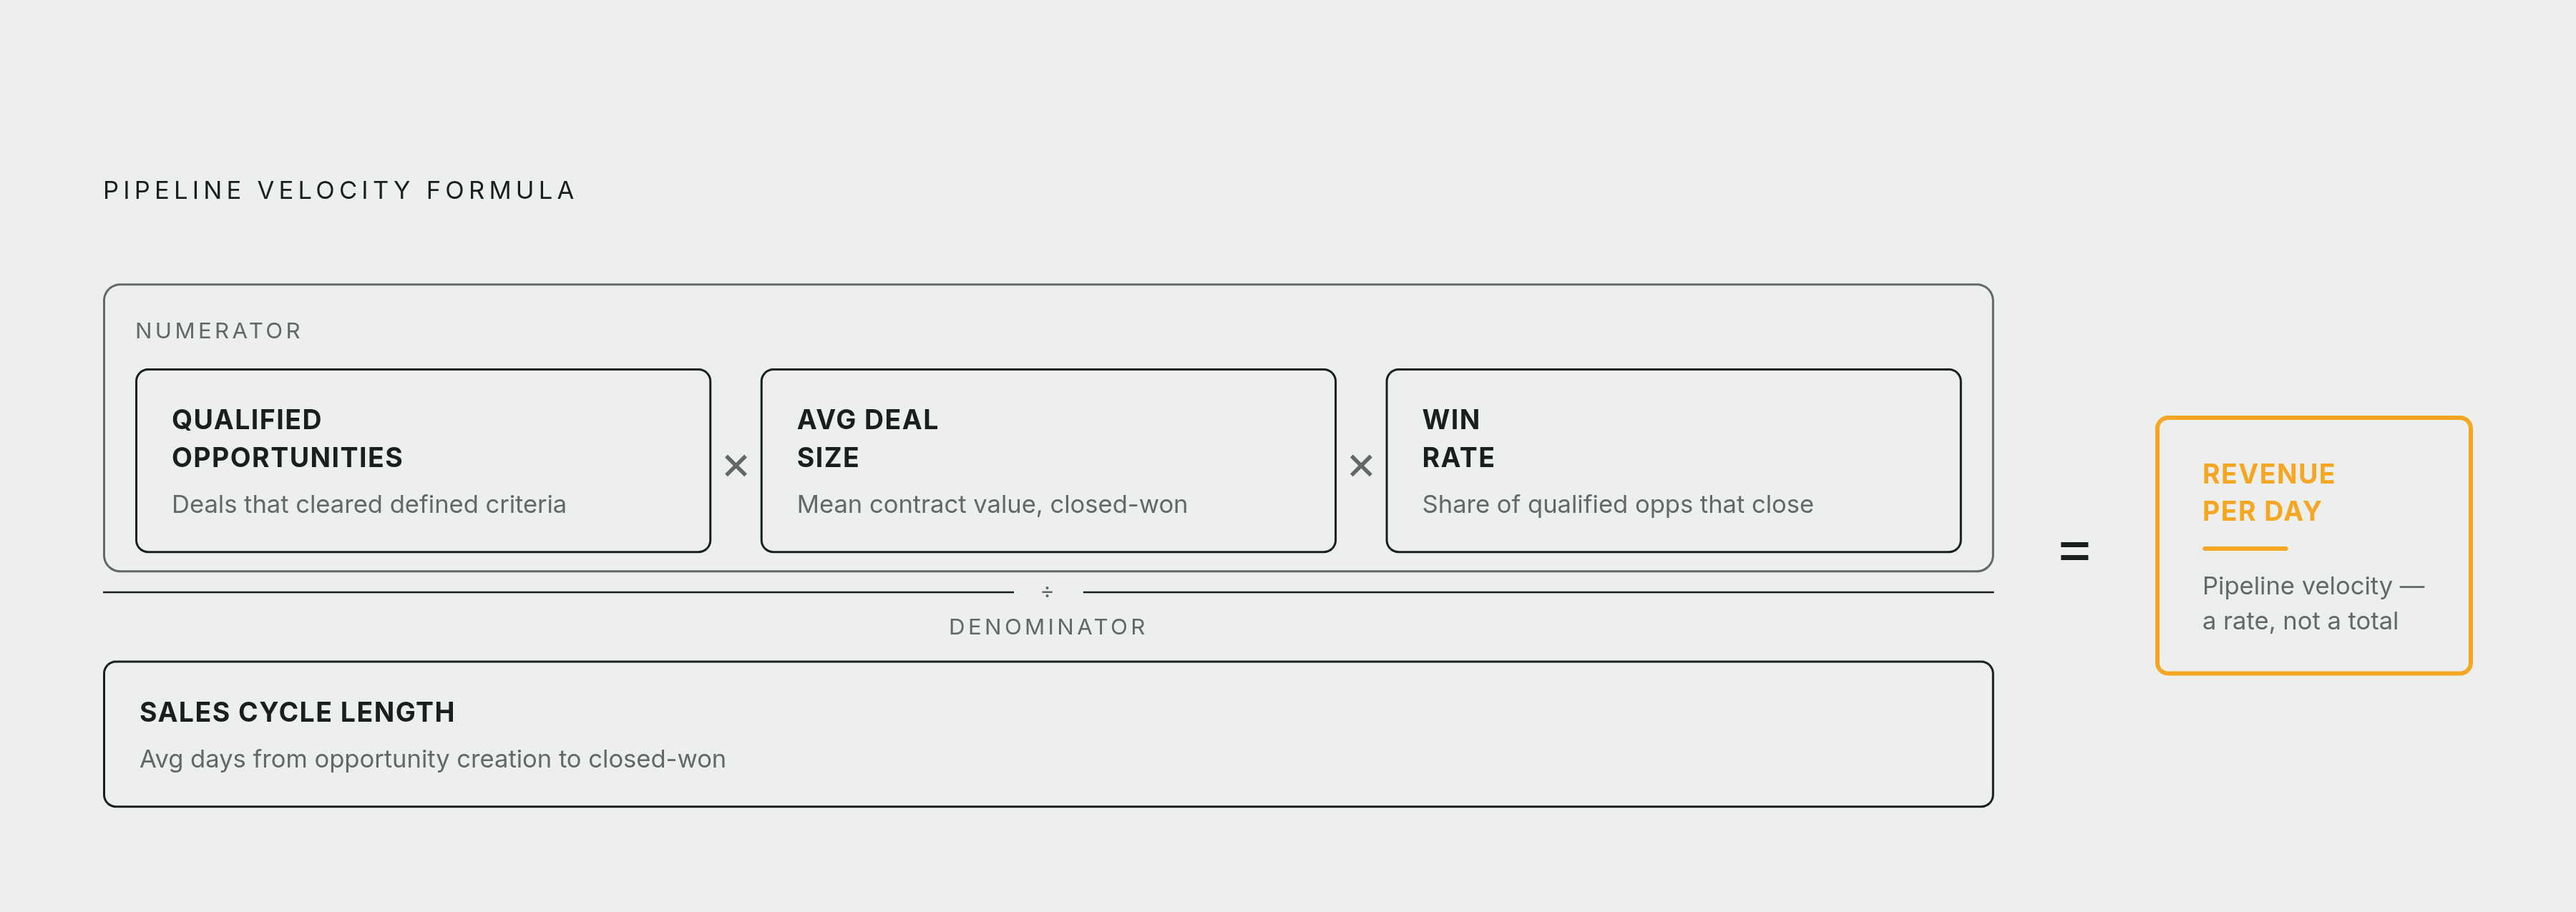
Pipeline Velocity = (Number of Qualified Opportunities × Average Deal Size × Win Rate) ÷ Sales Cycle Length in days.
The output is dollars of revenue per day. Qualified opportunities are active deals that have cleared defined qualification criteria. Sales must have checked that those deals are a fit before they count. Average deal size is the average contract value of closed-won deals, measured the same way each time. For SaaS, that is typically new ARR.
Win rate is the fraction of qualified opportunities that close as wins. Its denominator must match the qualification gate used for the opportunity count. Sales cycle length is the average number of days from opportunity creation to closed-won. Those definitions hold the calculation together. Changing the deal-value definition from quarter to quarter breaks the comparison even if the arithmetic remains flawless.
To follow the calculation, multiply qualified opportunities by average deal size, then apply the win rate to that value. Divide the result by the sales cycle in days to express it as a daily rate. “Sales velocity” is also used for the same metric, so the label is less important than the calculation beneath it.
Why the four levers move velocity differently — and why three of them are underused
If any numerator input goes up by the same percentage and everything else stays fixed, velocity goes up by that same percentage. Shortening the denominator also raises the result, though a percentage reduction in cycle length is not mathematically identical to the same percentage increase in a numerator input. The arithmetic is tidy. The work required to change it is not.
Most B2B teams reach first for more opportunities because volume is visible, measurable, and tied to marketing spend. Yet that lever faces diminishing returns. If growth in the count comes from weaker qualification, win rate can fall as the funnel fills. More opportunities then become an expensive way to stand still, with a busier dashboard as the consolation prize.
A team could get the same gain in velocity by shortening its sales cycle and keeping the other inputs the same. That route has substantial internal leverage because process discipline, stage design, and handover quality shape cycle length. Win rate and average contract value depend in part on the market and how well the product fits. Cycle improvements can come without changing the product or buyer.
Win rate, meanwhile, is a quality lever whose meaning depends on what qualifies for its denominator. A higher rate is not automatically evidence of a stronger pipeline if the populations being compared differ. Deal size is a targeting and packaging lever, but moving upmarket also tends to extend the cycle. None of these observations makes one lever universally best. They make diagnosis more useful than reflexively buying more volume.
How the levers interact — and the trade-offs that trap teams trying to improve velocity
The phrase “everything else stays fixed” does a great deal of work in the formula. In practice, the levers are connected. Discounting to close can raise win rate while bringing down average contract value, so some of the gain is lost elsewhere in the numerator.
Adding unqualified deals creates a different trade-off. The opportunity count rises, but win rate falls and cycle length becomes distorted by deals that were never likely to close. Moving upmarket offers the temptation of larger contracts. Yet longer cycles can offset the larger deal value.
A weak input may be the consequence of a deliberate choice elsewhere. Even a high velocity figure leaves some of the business out of view, because winning low-margin deals often can yield a strong revenue rate. Velocity locates slowdowns, but margin and customer quality remain separate tests of whether that revenue is worth pursuing.
Three calculation errors that make the velocity number unreliable before you even start diagnosing
The first error is counting unqualified opportunities. Raw leads and unverified SQLs inflate the opportunity count while producing a misleadingly low win rate. The two inputs may look like separate findings, but they share a broken qualification boundary. Only deals that have cleared defined criteria belong in the formula.
The second error is win rate lag. Deals that closed recently came from pipeline choices made months earlier, while today’s open opportunities may come from a new region, pricing structure, or lead source. Last quarter’s rate can therefore misrepresent the current pipeline. The arithmetic will not warn anyone. In a fast-changing market, a neatly calculated result can still rest on an outdated assumption about conversion.
The third error is sales cycle distortion. A small number of reopened, recycled, or stale deals with uncorrected close dates can stretch the average enough to make a healthy pipeline look slow. When deal ages have a long tail, the median is a more robust view of typical cycle length. Using it changes the input from the average specified in the standard formula, so consistency and a clear definition are essential for comparisons.
There is also a naming trap before any diagnosis begins. HubSpot’s “Deal Velocity” report measures average time spent in each stage, rather than the four-variable revenue-per-day formula. That is a useful diagnostic, but a different one. Verify what any dashboard labelled “velocity” actually computes before quoting its result.
How to use velocity as a diagnostic — locating which lever is actually slowing revenue
A referral-sourced opportunity and a cold-outbound opportunity can have different win rates, deal sizes, and cycle lengths. Blending them into one figure conceals those differences. When the total falls, it cannot show which source is slowing conversion, and when it rises, it can hide weakness in one segment. Calculate velocity by pipeline source, deal size tier, rep, or sales motion.
For each segment, compare the current reading with its own trailing four-quarter moving average. This gives the comparison a relevant baseline. Repeat that comparison at each measurement cycle so the diagnostic becomes a rhythm.
Within an underperforming segment, identify the variable moving in the wrong direction. Is opportunity count falling, win rate declining, average contract value compressing, or cycle length stretching? Each answer points to a different constraint. Before acting, check how the planned change could affect the other three inputs, because discounting to shorten a cycle may also shrink deal size.
Stage-duration analysis can then narrow a cycle problem to qualification, the middle of the process, or late-stage negotiation. The overall calculation identifies the slow lever, while stage timing helps locate the obstruction. That is a more precise basis for intervention than a general instruction to make the sales process faster.
What published velocity benchmarks can and cannot tell a B2B revenue team
Published benchmarks vary a lot with the segment and how they are calculated. Without the deal size, win rate, and cycle inputs behind it, a single industry average says little about whether a team’s result is healthy. The daily revenue unit can make unlike businesses look comparable. It is still the same unit, but it may describe very different sales motions.
Benchmarks are useful for judging what range is plausible for a given segment and whether inputs are in the right order of magnitude. A team with larger contracts and longer cycles needs that context before interpreting a comparison with smaller, faster deals. Cross-source differences are another reason to examine definitions rather than treat a published figure as a universal standard.
For decisions about how to run the team, its own trailing four-quarter average within each segment is a better point of comparison. That comparison keeps attention on what changed. If win rate is falling, the next question concerns the opportunities, qualification, and execution behind that movement. An external benchmark can prompt an investigation, but it cannot identify the lever responsible for the gap.
Building velocity tracking into the team's operating rhythm
Salesmotion recommends that most B2B teams measure monthly or quarterly to spot trends early while allowing enough time to tell signal from noise and see how changes work. The cadence needs a consistent calculation beneath it. Keeping opportunity counts, deal values, stage dates, and close dates up to date between reviews is recurring data hygiene work.
At each measurement cycle, teams should segment velocity by pipeline source, deal size tier, and rep, compare each segment with its trailing four-quarter trend, and flag the variable that moved. The next step is ownership. Qualification belongs with sales leadership, cycle length with process and follow-up, deal size with targeting, and win rate with qualification and execution. Naming someone to own each lever gives that person a finding to act on after the meeting.
AI-assisted CRM and workflow tools can cut the admin work that this routine takes. Tools that work with Salesforce or HubSpot can use what they know about a deal to log updates, draft follow-ups, and book next steps automatically. These capabilities address the input-quality problem without asking reps to take on more administrative work. Their role is practical rather than magical, because cleaner records support a more dependable calculation.
The discipline is to measure all four levers together and evaluate changes in that same frame. Otherwise, a team can celebrate more opportunities, larger deals, or a better win rate while missing the offset elsewhere in the equation. The formula’s value is the ability to locate slowing revenue while there is still time to respond before the quarter ends.