SaaS Magic Number Calculation and Interpretation
Understand why this productivity metric matters more than most founders think it does.

The SaaS Magic Number is a single ratio: dollars of new recurring revenue per dollar of sales and marketing spend. Rory O'Driscoll at Scale Venture Partners developed the framework looking at Omniture, where the company was generating strong first-year revenue returns for every dollar it put into go-to-market. Lars Leckie formalized the math in 2008, and it spread through the SaaS community until it became one of the default scorecards for SaaS efficiency.
Here's what most people get backwards about it: they treat the Magic Number as a growth metric. It isn't. It's a productivity metric, and the difference matters more than the label suggests. A company can post huge ARR gains while burning cash faster than it earns it, and on paper that looks like success. Run the Magic Number and the story flips. It forces a ratio where vanity metrics let a founder avoid one. That's the whole point of the exercise, and it's why the calculation deserves more than the two-minute glance it usually gets before a board meeting.
The two formula variants and the annualization logic behind them
There are two versions of this formula, and picking the wrong one for the wrong audience is a common, avoidable mistake.
Variant 1: ARR-based. This is the one private companies should default to.
(Current Quarter ARR − Prior Quarter ARR) × 4 ÷ Prior Quarter S&M Expense
The ×4 annualizes a single quarter of ARR growth so it can be compared across periods on equal footing. Notice the denominator uses prior quarter S&M spend, not current. That's not an accident. There's a lag between the money spent on pipeline and the revenue that shows up because of it. Using last quarter's spend against this quarter's growth respects that lag instead of pretending sales and marketing convert to revenue instantly.
Variant 2: GAAP revenue-based. This one swaps GAAP revenue in for ARR, mainly because public companies report revenue in filings, not ARR. It lets analysts calculate a Magic Number for a public SaaS company using nothing but the income statement. The ×4 still applies, but now it's annualizing GAAP revenue growth, not net-new ARR.
Here's where people get tripped up: applying the ×4 multiplier to net-new ARR inside the wrong formula, or double-annualizing, produces a number that's inflated and wrong. That's not a rounding error. A falsely high Magic Number can talk a founder into hiring a bigger sales team or ramping ad spend on the strength of a number that was never real. Check the formula before checking the instincts it's feeding.
One more relationship worth knowing: CAC payback. Divide 12 by (Magic Number × gross margin) and the result is payback in months. A Magic Number of 0.8 at 80% gross margin works out to a CAC payback period of about 18.75 months. Same input, different lens.
Bottom line: private company, use ARR-based. Benchmarking against public peers, use GAAP-based. Mix them up and the comparison isn't apples to apples. It's two different instruments wearing the same label.
A worked calculation that shows what each input actually represents
Numbers make this concrete. Take a company with:
- Current quarter recurring revenue: $1,000,000
- Prior quarter recurring revenue: $750,000
- Net-new recurring revenue: $250,000
- Prior quarter S&M expense: $150,000
Magic Number = $250,000 ÷ $150,000 = 1.67
Simple enough. But the number only means something if the inputs mean something consistent quarter over quarter.
What counts as S&M expense: salaries, commissions, ad spend, the tools the sales and marketing teams use. All of it, every quarter, counted the same way.
What doesn't belong there: customer success costs (those live in COGS), product marketing headcount if it's really funded out of the product budget. Move these in and out from quarter to quarter, and the Magic Number trend line stops being a strategy signal. It becomes an accounting artifact wearing a strategy costume.
Consistency beats precision here, and this is worth saying plainly because most teams get it backwards: a perfectly calculated Magic Number this quarter and a slightly different methodology next quarter produces two numbers that can't be compared. A slightly imprecise number, calculated the same way every time, is worth more than a precise one that keeps changing its own rules.
One more wrinkle: sales cycle length. If deals take longer than 90 days to close, a quarterly Magic Number will understate how efficient the GTM motion actually is, because the revenue from this quarter's spend hasn't shown up yet. Companies with longer cycles get a truer read from a trailing twelve-month calculation, which smooths out that timing lag.
So, 1.67. Is that good? That depends largely on where it falls on the spectrum, which is the whole next section.
The interpretation thresholds and the decisions each zone implies
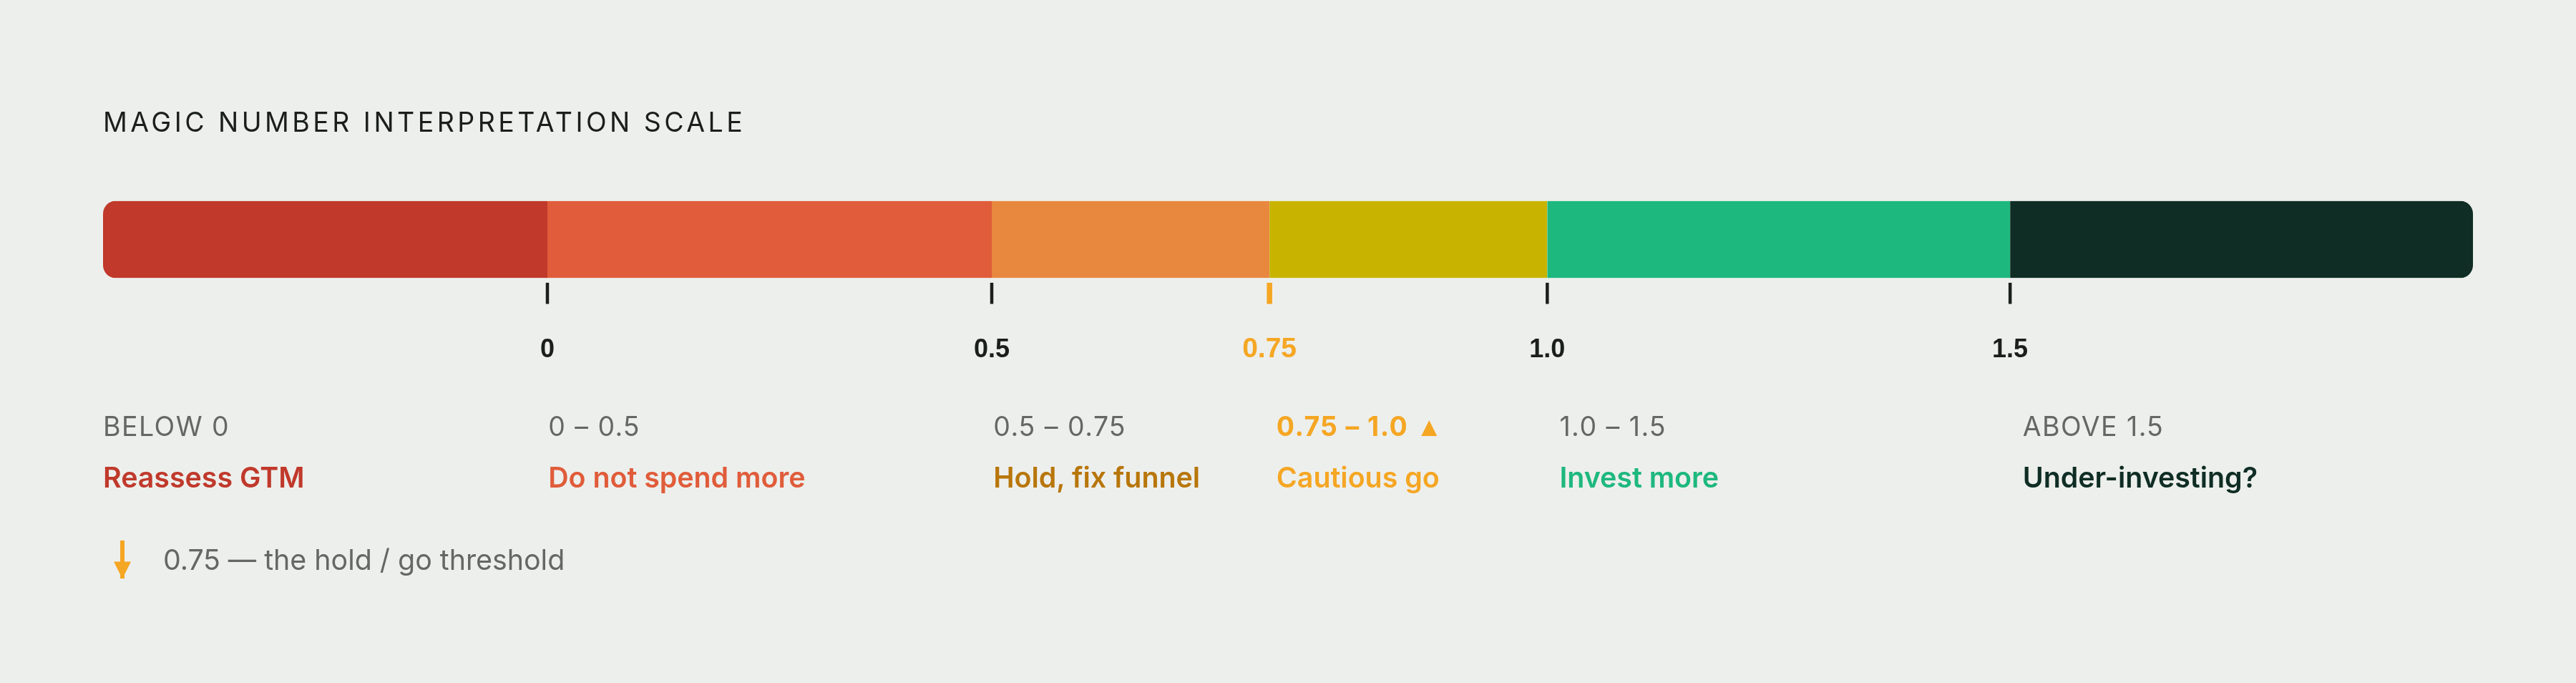
Leckie's original 2008 framing was blunt: below 0.75, step back. Above 0.75, pour on the gas. Above 1.5, call him immediately. Good rule of thumb. Too blunt to run a company on by itself. Here's the fuller spectrum, zone by zone, and what each one is actually telling someone to do.
- Below 0: Something worse than inefficiency is happening. Net customer loss, or churn severe enough to outpace new acquisition. This needs an immediate GTM reassessment, not a tweak to the budget.
- Below 0.5: Red flag territory. Usually points to weak product-market fit, a cost-to-serve problem, or churn eating faster than new logos can replace it. Spending more here doesn't fix the problem. It accelerates it.
- 0.5 to 0.75: Below the efficiency threshold. Hold spend flat and go investigate the funnel. Is the drag in acquisition, or is it retention?
- 0.75 to 1.0: Healthy enough to start expanding. Not a full green light, but the machine is running. 0.75 is the gas-pedal line.
- 1.0 to 1.5: The sweet spot. Roughly $1 to $1.50 in new ARR for every dollar of S&M. Invest more. The return justifies it.
- Above 1.5: The paradox zone. Looks great on a slide. Can also mean the company is under-investing in go-to-market, leaving growth on the table by not feeding a machine that's clearly working.
Each zone comes with a different action, not just a different grade. That's the entire value of the framework. Knowing the score is 0.6 doesn't help anyone. Knowing that 0.6 means "hold spend and go find out whether it's a funnel problem or a retention problem" does.
One caveat worth sitting with: these thresholds were built for a world where 1.0 was the assumed baseline. That world has shifted. Median Magic Numbers for public SaaS companies have dipped as low as the 0.3 to 0.7 range in recent years, a reflection of higher customer acquisition costs and longer sales cycles across the industry. The thresholds still work as targets. They just need to be read against a market that's gotten harder to be efficient in.
Where the standard Magic Number misleads without gross margin and NRR adjustments
Here's the blind spot in the standard formula, and it's a real one: it treats every dollar of ARR as identical. It never asks what it costs to deliver that revenue, and that's the part that quietly wrecks board conversations.
Two companies can post the same Magic Number and be in very different shape, because gross margin changes what that revenue is actually worth. A Magic Number of 0.85 at 62% gross margin adjusts down to roughly 0.53 once delivery cost is factored in, a meaningfully different signal than the headline number suggests. A company running well below the 72 to 78% gross margin band typical of public SaaS peers is generating "efficient" revenue that costs more to deliver than its peers', and the unadjusted Magic Number hides that completely.
The fix: multiply the standard Magic Number by gross margin percentage. This gross-margin-adjusted number is increasingly what shows up in investor diligence, for good reason. It's a more complete version of the same story, and any founder who presents the unadjusted number alone is presenting half the picture.
Net revenue retention creates a similar distortion, and arguably a bigger one. A Magic Number of 0.8 means something very different at 110% NRR than it does at below-average NRR. In the first case, existing customers are expanding and compounding whatever the GTM engine already built. In the second, churn is quietly draining the tank while the company keeps pouring in new fuel.
There's a related trap worth naming: if most of the net-new ARR in that calculation is coming from expansion rather than new logos, the Magic Number is flattering the wrong team. The efficiency it's signaling belongs to customer success, not to the acquisition motion the company is actually trying to evaluate.
So the rule here is close to non-negotiable: never present a Magic Number to a board or investor without stating the gross margin next to it. The unadjusted number by itself isn't a complete picture. It's a headline missing its footnote.
How current benchmarks vary by company stage, funding type, and GTM motion
Context changes what "good" looks like. A single benchmark applied across every company stage will mislead in both directions, which is exactly why founders who compare themselves to a flat 0.75 line usually end up either falsely reassured or falsely alarmed.
By ARR band, private SaaS medians look roughly like this:
- Pre-seed/seed (under $1M ARR): around 0.4. Product-market fit is still being figured out, so efficiency expectations should stay low.
- Seed to Series A ($1M–$10M ARR): 0.68 to 0.80. Efficiency starts to matter; trajectory matters more than any single quarter.
- Series A to Series B ($10M–$50M ARR): 0.70 to 0.89. Investors want a repeatable motion, not a lucky quarter.
- Series B+ ($50M+ ARR): 0.60 to 0.85. A lower number here can still coexist with a healthy business if NRR is running 110 to 120% or higher, since burn multiple and profitability become the bigger frame at this stage.
By funding source: PE-backed companies tend to run higher Magic Numbers, since efficiency is often the priority from the day ownership changes hands. VC-backed companies often sit closer to the 0.75 line, since growth-at-cost is a more tolerated strategy in pursuit of market share. Bootstrapped companies tend to run higher too, driven by plain capital discipline. There's little capital to waste, so the number reflects that.
By GTM motion, the differences get sharper, and this is where the "0.75 is the bar" mindset really falls apart. Inbound-dominant companies tend to post the highest Magic Numbers, since a mature content engine generates leads at a fraction of the marginal cost of outbound. Outbound SDR-driven companies post a median closer to 0.64, sitting just under the 0.75 threshold. That's not necessarily a sign of poor execution. It's structural. The full cost of sourcing pipeline through SDRs is baked directly into the denominator. Per Tomasz Tunguz of Redpoint Ventures, the average Series A SaaS company runs a Magic Number around 0.6, improving over time as the motion matures and repeats more reliably.
Benchmarkit's 2024 B2B SaaS Performance Metrics Benchmark Report found a median Magic Number of 0.90, with top-quartile performers above 2. AI-focused SaaS companies significantly outperformed the broader market that year, posting Magic Numbers of 1.0 or higher while most of the sector held in the 0.7 to 0.9 range.
What investors actually check at each fundraising stage
The bar moves as the company grows, and knowing where it sits at each stage keeps founders from either panicking too early or coasting too long.
At Series A ($5–15M ARR), a Magic Number of 0.6 to 0.75 is often fine, especially if the company is still refining its ideal customer profile and building a repeatable motion. Investors are watching the direction of travel more than the current score.
At Series B ($15–40M ARR), the bar tightens. Investors expect the number trending toward or holding above 0.75 consistently, typically across two to three quarters. A single good quarter rarely satisfies this bar. A trend does.
At Series C and beyond, a sustained Magic Number above 1.0 is close to table stakes. Anything below 0.75 in the twelve months leading into a raise tends to generate pointed questions about unit economics, and those questions don't go away with a good story.
OpenView data shows companies in the $5M to $25M ARR range with a Magic Number above 0.75 were 2.3 times more likely to raise their next round at a flat or up valuation compared to peers below that line. That gap is the whole argument for taking this number seriously well before a raise, not during one.
The practical takeaway, and the one that gets ignored the most: a single strong quarter right before a raise rarely cuts it. Investors want a trend across multiple quarters, which means the work of improving the number has to start well before the data room opens.
Why a low Magic Number demands a diagnosis before a budget cut
A low Magic Number tells you something's wrong. It does not tell you what. That distinction matters enormously, because the instinct to cut spend the moment the number dips is, more often than not, the wrong instinct. It treats a symptom as if it were the disease, and it's the single most common mistake founders make with this metric.
A weak score can come from several very different places:
- New logo acquisition costs too much relative to average contract value (a pricing or ICP problem)
- Churn is outpacing new business and dragging net-new ARR down (a retention problem)
- Sales cycles run longer than the quarterly window, making the number look worse than reality (a measurement problem)
- S&M spend got inflated by a one-time event, like a rebrand or a conference push, that won't repeat (an accounting problem)
- Real weakness in product-market fit (the hardest problem, and the one that spending alone is unlikely to fix)
Before touching the budget, work through a diagnostic sequence:
- Separate new logo ARR from expansion ARR. If expansion is doing the heavy lifting, the acquisition motion needs its own scrutiny, separate from the blended number.
- Check churn and NRR alongside the Magic Number. The combination tells a fuller story than either number does alone.
- Review the time window. If sales cycles run past 90 days, recalculate on a trailing twelve-month basis before drawing any conclusions.
- Segment by channel. Magic Numbers vary a lot by GTM motion, and a blended number can hide a strong inbound engine getting dragged down by a struggling outbound program.
Here's the trap worth naming directly: cutting S&M spend mechanically raises the Magic Number, because the denominator shrinks. That's arithmetic, not strategy. If the company was already under-investing relative to a genuinely productive motion, that cut doesn't fix anything. It just makes the math look better while starving the exact engine that was working.
Turning the Magic Number into an operating cadence, not a quarterly report
The Magic Number earns its keep as a trend line, not a snapshot. One quarter's number is noisy, shaped by timing, one-off spend, and deal-close luck. Three or more quarters start to reveal whether the GTM motion is actually improving, holding steady, or sliding.
Build it into the regular rhythm of the business. Pair it with NRR, CAC payback, and gross margin every time it shows up in a quarterly business review, so no single number gets to tell a misleading story on its own. A Magic Number without its gross margin footnote is half a sentence.
Set the decision triggers ahead of time, not in the moment. Decide in advance: what score triggers a hiring freeze, what score triggers a green light on a new outbound hire, what score triggers a full funnel review before any dollar moves. Set these thresholds during a calm quarter, not in the panic of a bad one, and the response stays proportional to the actual problem instead of the mood in the room.
The formula itself takes about ten seconds to calculate. That's rarely the hard part. The hard part, and the part that actually separates companies that use the Magic Number well from the ones that just report it and move on, is tracking it consistently, reading it next to the metrics that give it context, and acting on it before a fundraise forces the question.