QBR Structure and Agenda for Sales Teams
A practical framework for structuring quarterly sales reviews that actually drive decisions.

There is a running joke in sales: QBRs are the meeting everyone hates preparing for, everyone tolerates attending, and nobody remembers two weeks later. If you have been in a sales org for more than a year, you have probably sat in at least one that felt like a slow slide presentation with a catered lunch attached.
Here is the question worth sitting with: is that a QBR problem, or a structure problem?
My bet is the latter. And after running and attending more of these than I care to count, I have come to believe that a badly structured QBR is not just a wasted afternoon. It is a missed governance moment. A quarterly opportunity to diagnose, align, and plan. Gone.
So let's walk through what that structure actually looks like when it works.
Before that, one distinction worth making upfront: there are two very different meetings that share the name "QBR." The internal sales QBR is a rep and manager (or team and leadership) reviewing performance, diagnosing gaps, and planning the next quarter. The external customer QBR is a vendor and customer reviewing value delivered and aligning on what comes next. Same four-letter acronym. Completely different audiences, metrics, and definitions of success. This guide focuses on the internal QBR first, because that is where most sales teams struggle most and where structure is least documented. The external version gets its own section later.
Why a Broken Sequence Quietly Kills Your QBR
The failure mode is almost never laziness or bad intentions. It is sequencing.
Teams jump to next-quarter goals before they have thoroughly diagnosed what happened last quarter. Or they spend the entire session in deal-level detail and never get to strategy. Or leadership presents slides at the team for ninety minutes and calls it a review.
The symptoms are recognizable:
- The meeting ends with no documented action items, or items that belong to "the team" rather than a named person.
- The same problems surface quarter after quarter because root cause was never actually isolated.
- The ratio of presentation to discussion is inverted. Most of the time is spent presenting; discussion gets whatever is left.
A large share of senior executives, when surveyed about vendor QBRs specifically, describe the meeting as a poor use of their time. That perception problem starts with structure that looks like reporting rather than decision-making.
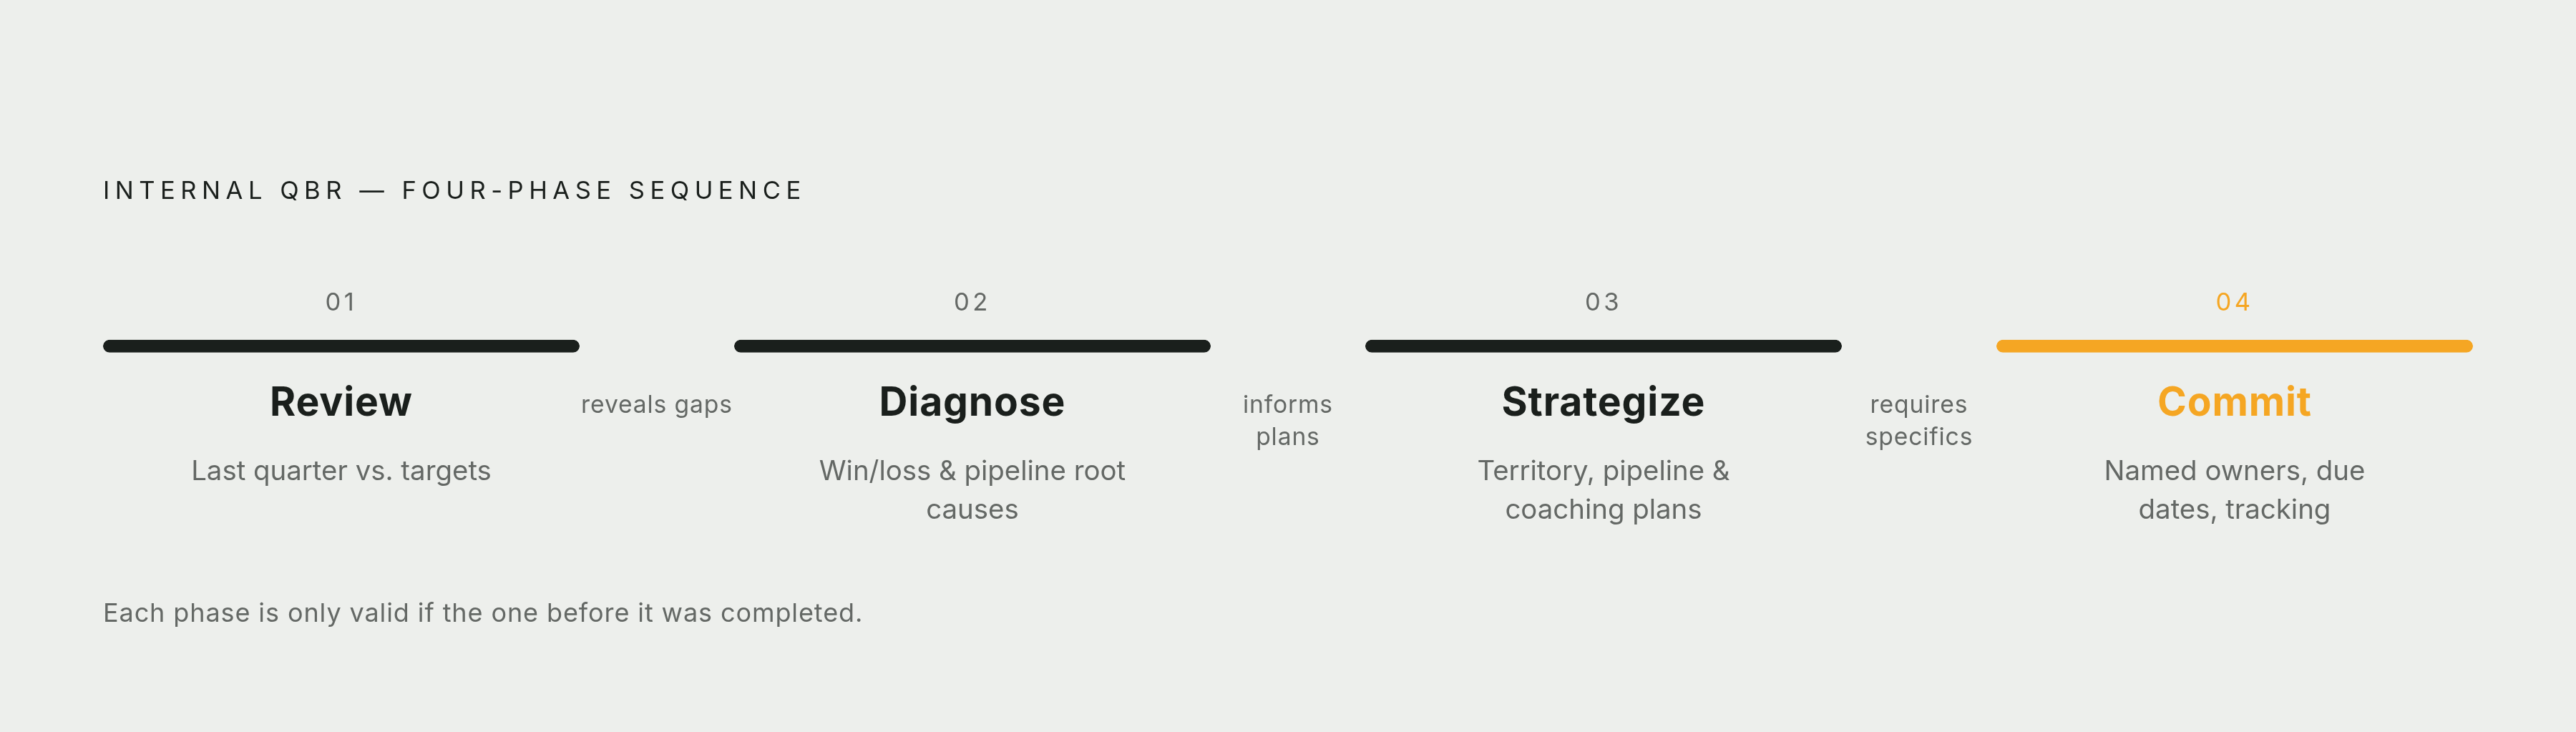
Here is why sequencing matters so much. Each phase of a well-run QBR sets up the next one. You cannot credibly set next-quarter targets without first diagnosing why last quarter landed where it did. You cannot diagnose without a clear performance review. And you cannot close with real commitments unless the strategy section was specific enough to generate them.
The through-line for everything that follows is a four-phase sequence: review, diagnose, strategize, commit.
How to Prepare Before the Meeting Opens
A QBR should happen within roughly two weeks of quarter close. Data is fresh. The next quarter is still shapeable. Wait much longer and you are planning in hindsight.
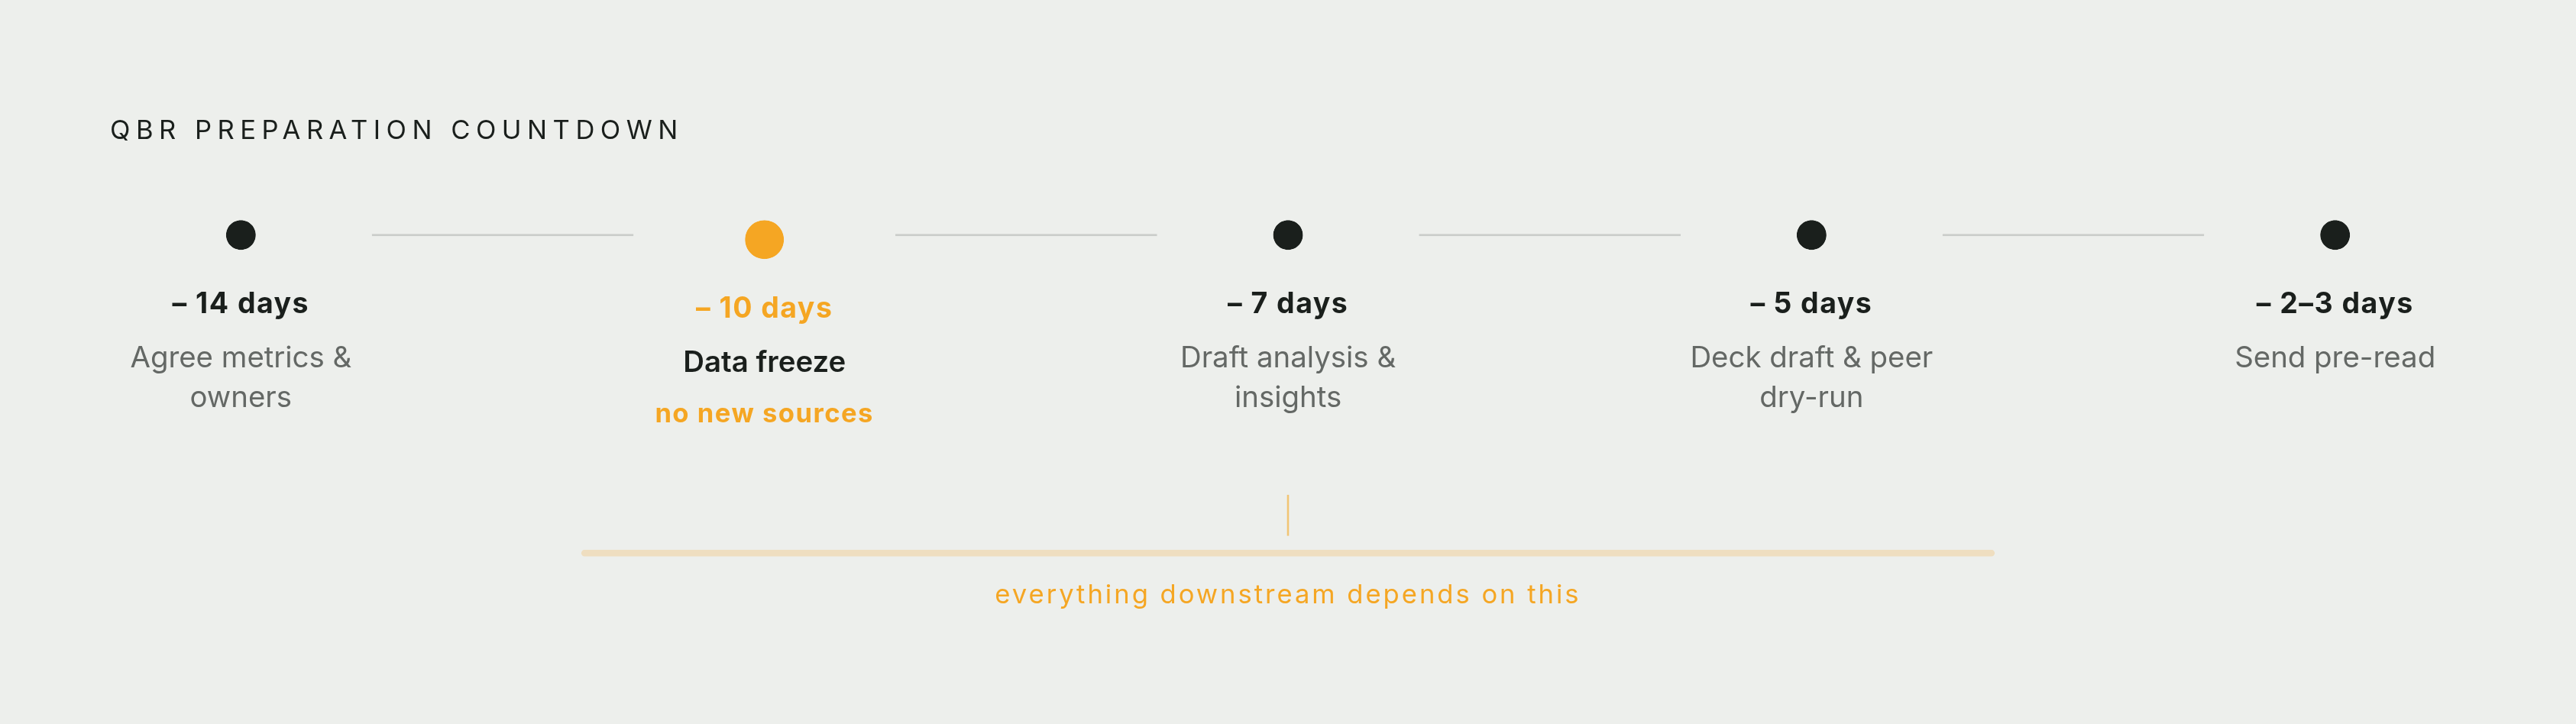
Best-practice preparation runs on a countdown that looks something like this:
- Two weeks out: agree on which metrics will be reviewed and who owns pulling each one.
- Ten days out: freeze the data. No new sources introduced after this point. Unvetted numbers surfacing in the room are a credibility killer.
- One week out: draft the analysis and key insights, not just the charts. Anyone can pull a chart. The insight is the work.
- Five days out: first version of the deck, dry-run with a peer.
- Two to three days out: send the pre-read. Attendees should arrive with context, not cold.
The meeting itself should run roughly seventy percent discussion, thirty percent presentation. If those numbers are flipped in your sessions, that is the first thing worth fixing.
Two other prep traps that bite teams consistently:
Slides. More than a handful of slides per presenter is usually scope creep dressed up as thoroughness. If you cannot make your point in a few focused slides, the problem is analysis, not slide count.
CRM hygiene. Pipeline data that has not been updated cannot support solid analysis. If reps are spending meaningful time cleaning CRM records the week before the QBR, that is a signal that hygiene slipped during the quarter. Tools that log calls, emails, and stage changes automatically throughout the quarter (rather than in a scramble before the review) reduce this prep burden significantly and make the data review far more credible. More on this in the last section.
Opening the QBR: Setting Context and Wins Before Diving Into Numbers
The opening has exactly two jobs: orient the room and set a productive tone. It should be brief. It should not be a pep talk.
Sales leadership opens with a clear statement of what the session is meant to accomplish. What decisions need to be made? What does a good outcome look like today? That framing matters because it signals to everyone in the room that this is a decision-making meeting, not a reporting session.
Then. Start with wins.
This is not cheerleading. Wins are data. Highlighting closed deals with enough context to be instructive (what kind of prospect, what drove the decision, what the rep did that worked) is pattern identification. It also positions the team to receive harder analysis without getting defensive. That matters more than people usually acknowledge.
What not to do:
- Open with the biggest miss of the quarter.
- Open with no agenda statement at all.
- Skip wins entirely because you are in a rush to get to the numbers.
Keep this opening section short. Its job is to ground the room, not consume the meeting's best energy.
Reviewing Last Quarter's Performance Against Targets
The KPI scorecard is the spine of this section. The key word being consistent. The same metrics, reviewed every quarter, so trends become visible rather than just snapshots.
Core metrics that belong in a QBR:
- Revenue performance against quota
- Win rate, average deal size, and sales cycle length
- Pipeline coverage entering the quarter just closed versus what was actually needed
- Forecast accuracy: how far did the final commit deviate from actuals, and where did the miss originate
- Stage conversion rates, especially where deals stall or exit
- New pipeline created during the quarter
Metrics that do NOT belong here: deal-level detail on individual opportunities. That belongs in weekly pipeline reviews, not a quarterly strategic session.
One principle worth stating plainly: a small number of metrics reviewed deeply beats a large deck of charts. Every metric in the review should connect to a decision someone in the room needs to make. If it does not, cut it.
The operative move in this section is variance analysis. Not just whether targets were hit, but why performance landed where it did. Exceeded, met, or missed, and what drove each outcome.
This section surfaces the what. The next section works on the why.
Diagnosing Root Causes Through Win/Loss and Pipeline Analysis
This is the most underused section in most QBRs. Teams either skip it entirely or treat it as a deal post-mortem rather than a pattern-recognition exercise.
Win/loss analysis done well asks:
- Why did key deals close? What buying signals, competitive dynamics, and rep behaviors showed up consistently?
- Why did others slip or die? At what stage? Against which competitors? What objections recurred?
Patterns across losses are far more useful than any single loss post-mortem. One lost deal is a data point. Five lost deals at the same stage against the same competitor is a structural signal.
Pipeline analysis goes deeper than coverage ratio:
- Age distribution: how much pipeline has been sitting in the same stage longer than your average sales cycle?
- Activity recency: what proportion of open pipeline has had a meaningful touch in the last thirty days?
- Stage conversion by segment: where does the conversion rate differ between segments, and what does that imply about territory design or message fit?
But here is the diagnostic discipline that actually separates strong QBRs from weak ones.
You have to separate execution gaps from structural gaps.
An execution gap is a rep skill or behavior that coaching can address. A structural gap is a territory design problem, an ICP definition problem, a pricing or product issue that requires a cross-functional response. Mixing these up leads to coaching reps on problems that were never theirs to solve. That is demoralizing, and it doesn't fix anything.
Every finding from this section should feed directly into either the coaching agenda or the next-quarter planning agenda. Nothing from this analysis should be left on the table without an owner.
Building the Forward-Looking Strategy for the Next Quarter
This is where the QBR earns its keep or wastes everyone's time. The diagnostic section identified the gaps. This section decides what to do about them.
Territory and prospecting plans. What do the next ninety days look like in terms of targets, coverage, and outreach priorities? Best practice: keep these focused on top opportunities and the pipeline coverage gaps identified in the diagnostic section. A territory plan that runs multiple pages is not a plan. It is a data dump.
Pipeline build targets. What new pipeline needs to be created this quarter? Break it down by segment or channel, based on coverage shortfall from the review. Vague targets like "build more pipeline" are not targets.
Coaching and skills development. This is the section that most consistently gets squeezed when sessions run long. That is backwards. Research repeatedly surfaces that coaching is among the top priorities leaders name for their sales teams. Yet it is the first thing cut when time runs short.
Coaching conversations in this section should be grounded in the execution gaps surfaced during diagnosis, not a generic list of training topics. The manager and rep identify specific skill gaps (cold calling approach, late-stage negotiation, multi-threading) and agree on a development plan with measurable checkpoints. That specificity is what makes it actionable.
Go-to-market alignment. If the QBR surfaces patterns that implicate marketing, product, or operations, this is where those flags get raised. Not buried in the deck notes. Raised, assigned, and followed up.
The strategy section should end with enough specificity that the closing commitments are obvious, not aspirational.
Closing With Concrete Commitments and Assigned Ownership
Every QBR should end with a written action log. Not a verbal summary. Not a promise to "circle back."
Each item in the log needs four things:
- What will be done
- By whom (a named person, not "the team")
- By when
- How progress will be tracked
Items without a named owner do not survive the meeting. Assign them before the room clears.
Two documents give the QBR durable weight beyond the day itself: the pre-read sent before the meeting and the action log sent after it. Everything else is context.
Next-quarter goals should be stated as specific, measurable targets. "Improve pipeline hygiene" is not a goal. "Achieve ninety percent CRM stage accuracy by the end of week four" is a goal.
And the action log is not just a closing document. It is the opening document for the following QBR. The first thing reviewed next quarter is whether the commitments from this one were kept. That single practice is what converts a QBR from a meeting about accountability into a mechanism that actually creates it.
How the External Customer QBR Follows the Same Sequence With Different Content
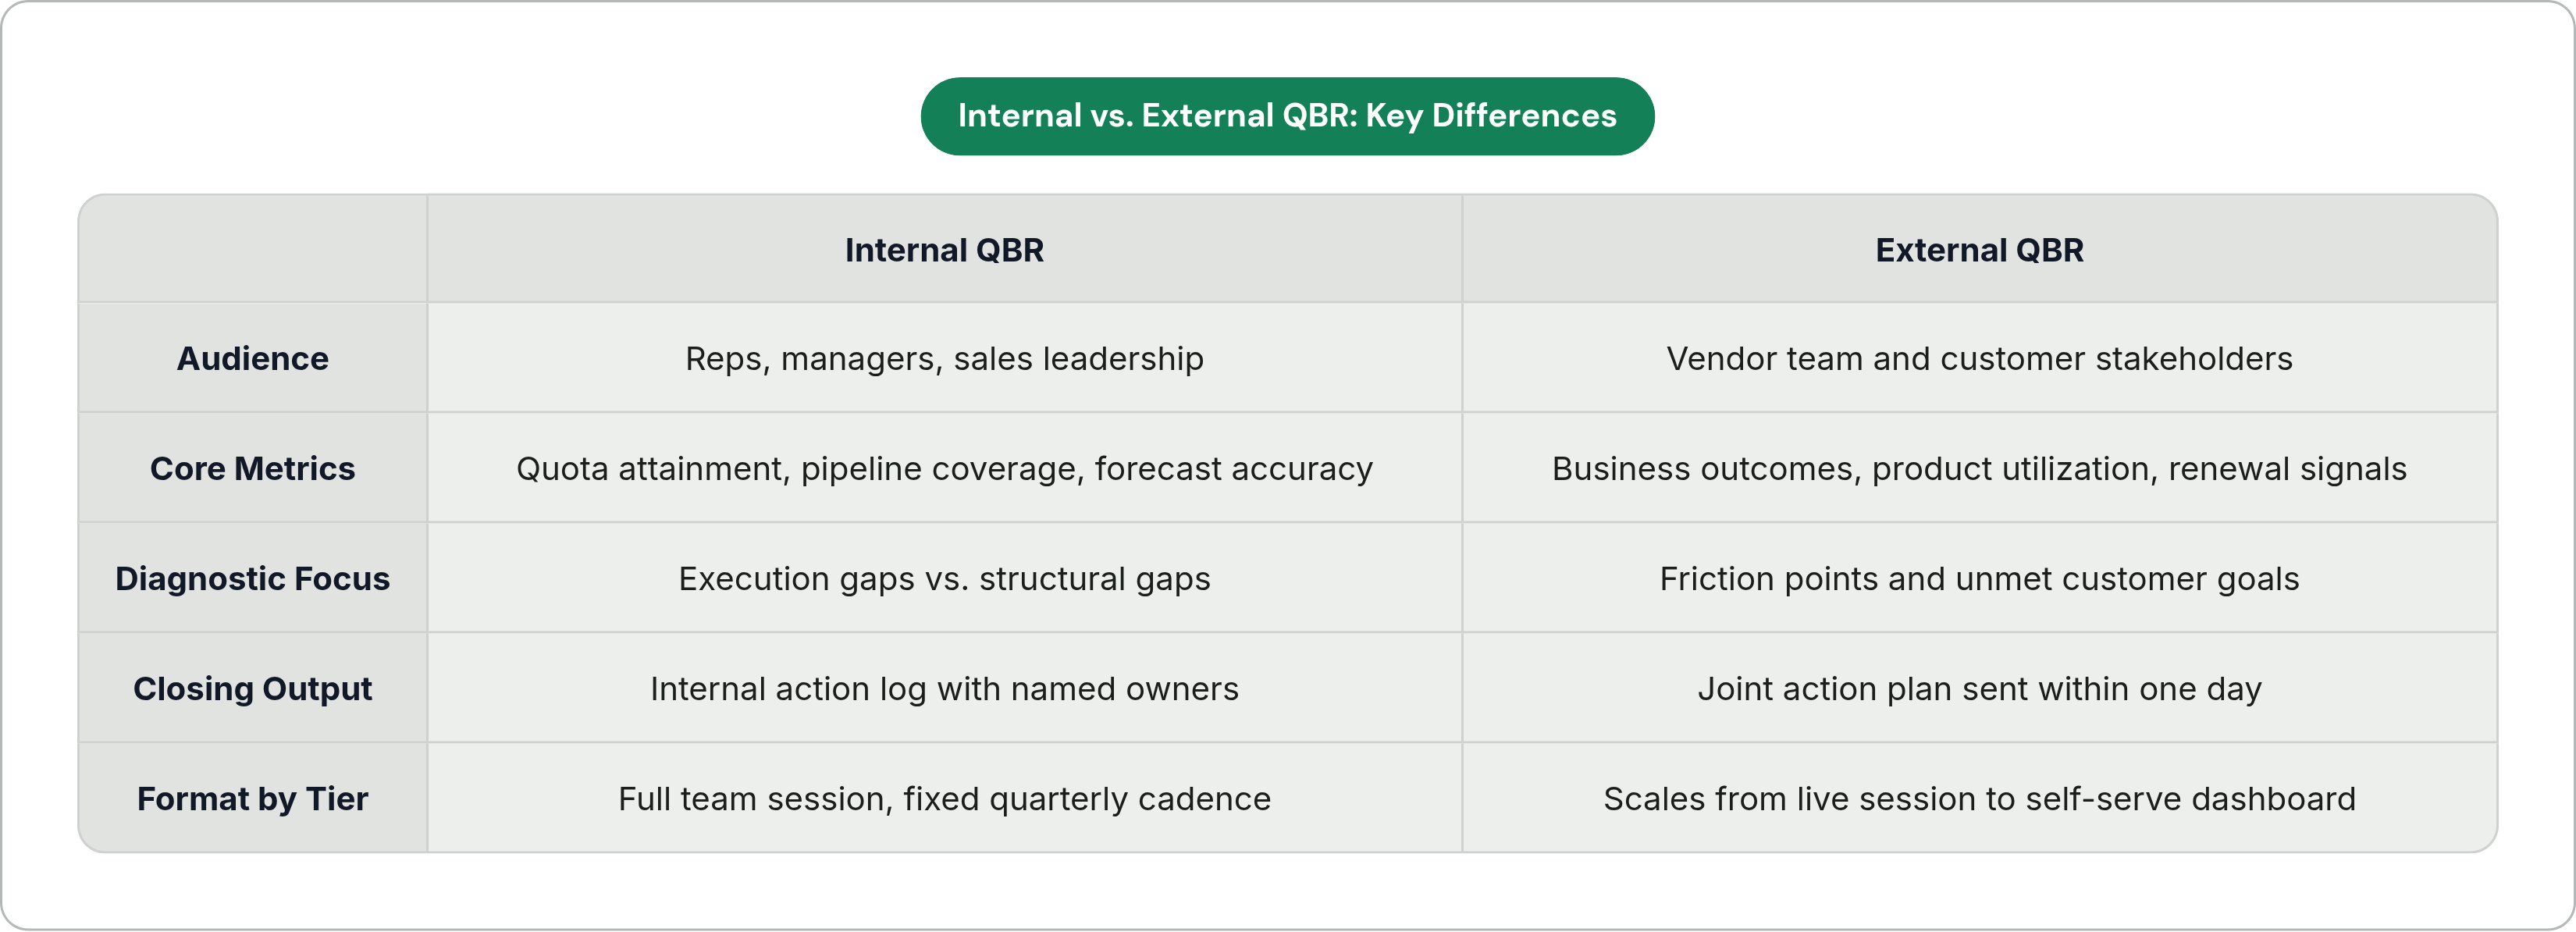
The four-phase logic holds for external QBRs. Review value delivered, diagnose friction and gaps, align on the customer's next-quarter goals, and commit to a joint action plan. The sequence is the same. The content is completely different.
A section-by-section translation for a typical B2B SaaS external QBR:
Partnership recap (brief). What goals did the customer set last quarter? What did your team commit to? This prevents the rest of the conversation happening in a vacuum.
Performance and value delivered. Present metrics that matter to the customer's business outcomes, not your platform's internal usage data for its own sake. The customer does not care how many logins happened. They care whether the problem they bought you to solve is actually being solved.
Customer goals for next quarter. Ask. Listen. Document. This informs expansion strategy and shapes your preparation for the next QBR.
Joint action plan. What does your team commit to? What do you need from the customer? What is the timeline? Send this within a day of the meeting. The longer you wait, the more it loses momentum.
One distinction worth flagging: internal QBRs track quota attainment and pipeline coverage. External QBRs track product utilization, business outcomes achieved, and renewal or expansion indicators. Same structure. Different scorecard entirely.
Account tier should calibrate the format:
- Strategic enterprise accounts: full agenda, longer session, often in person.
- Mid-market: virtual, roughly an hour, same structure.
- Lower-ACV accounts: a self-serve digital dashboard can replace the live meeting entirely.
There is also a QBR versus EBR distinction worth knowing. QBRs involve day-to-day account contacts reviewing tactical progress. Executive business reviews involve C-level stakeholders, happen less frequently, and focus on strategic vision and multi-year direction. Same four-phase logic, much higher stakes, much longer prep cycle.
Where Administrative Overhead Quietly Undermines QBR Quality
Here is the thing nobody talks about when they talk about QBR structure.
The most common reason QBR preparation is thin is not that people do not care. It is that reps and managers spend the week before the session pulling data, cleaning CRM records, and rebuilding context they should have had all along.
When call notes, email threads, and deal updates live in a rep's head rather than the CRM, the performance review is built on incomplete evidence. The diagnostic section suffers most. Root-cause analysis requires accurate activity data. If the CRM does not reflect what actually happened in conversations, the diagnosis is guesswork dressed up as analysis.
That raises an important question. Is this an analytical problem or an administrative one?
It is administrative. Teams are not bad at diagnosis. They are missing the inputs diagnosis requires.
And the compounding effect is real. Reps who spend hours on pre-QBR data entry have less time on the relationships and deals the QBR is ultimately meant to improve. The preparation undermines the purpose.
The practical fix is keeping records current throughout the quarter rather than in a rush before the review. Tools that run alongside inbox, calls, and CRM to log updates and draft next steps automatically (Nextstep is one worth looking at here) reduce this burden without pulling reps off active deals. The payoff is not just time saved. It is that the QBR analysis is grounded in what actually happened, not a reconstructed version of it.
A QBR is only as good as the data it runs on. Which means the work of making QBRs better does not start in the meeting. It starts ninety days earlier, in the daily habits that keep the record accurate.
Get that right, and the structure in this guide does what it is supposed to do.