Outbound Sales Metrics Every SDR Team Should Track
A diagnostic guide to identifying where your SDR funnel actually breaks down.

There's a number floating around GTM circles right now that should make every sales leader uncomfortable. Per Ebsta and Pavilion's 2025 benchmarks, 76% of sellers missed quota in the first half of 2025. Salesforce's 2024 State of Sales found that 67% of reps don't even expect to hit their annual number.
That's not a slump. That's a structural problem.
And here's the thing. When you dig into why teams are missing, the answer almost never comes back as "we just need to work harder." It comes back as something murkier. Nobody can quite point to where the deals are dying. The activity numbers look fine. The pipeline looks okay on paper. But quota keeps slipping, and nobody has a clean explanation.
The real culprit, more often than not, is how teams are tracking performance in the first place. Either they're measuring the wrong things, or they're measuring everything and acting on nothing.
This piece is a stage-by-stage walkthrough of the metrics that actually tell you where outbound is breaking down. Not a checklist. A diagnostic.
How to Think About SDR Metrics as a Connected Funnel, Not a Checklist
Before we get into the numbers, we need to agree on the framework. Because the way most teams look at SDR metrics is the problem itself.
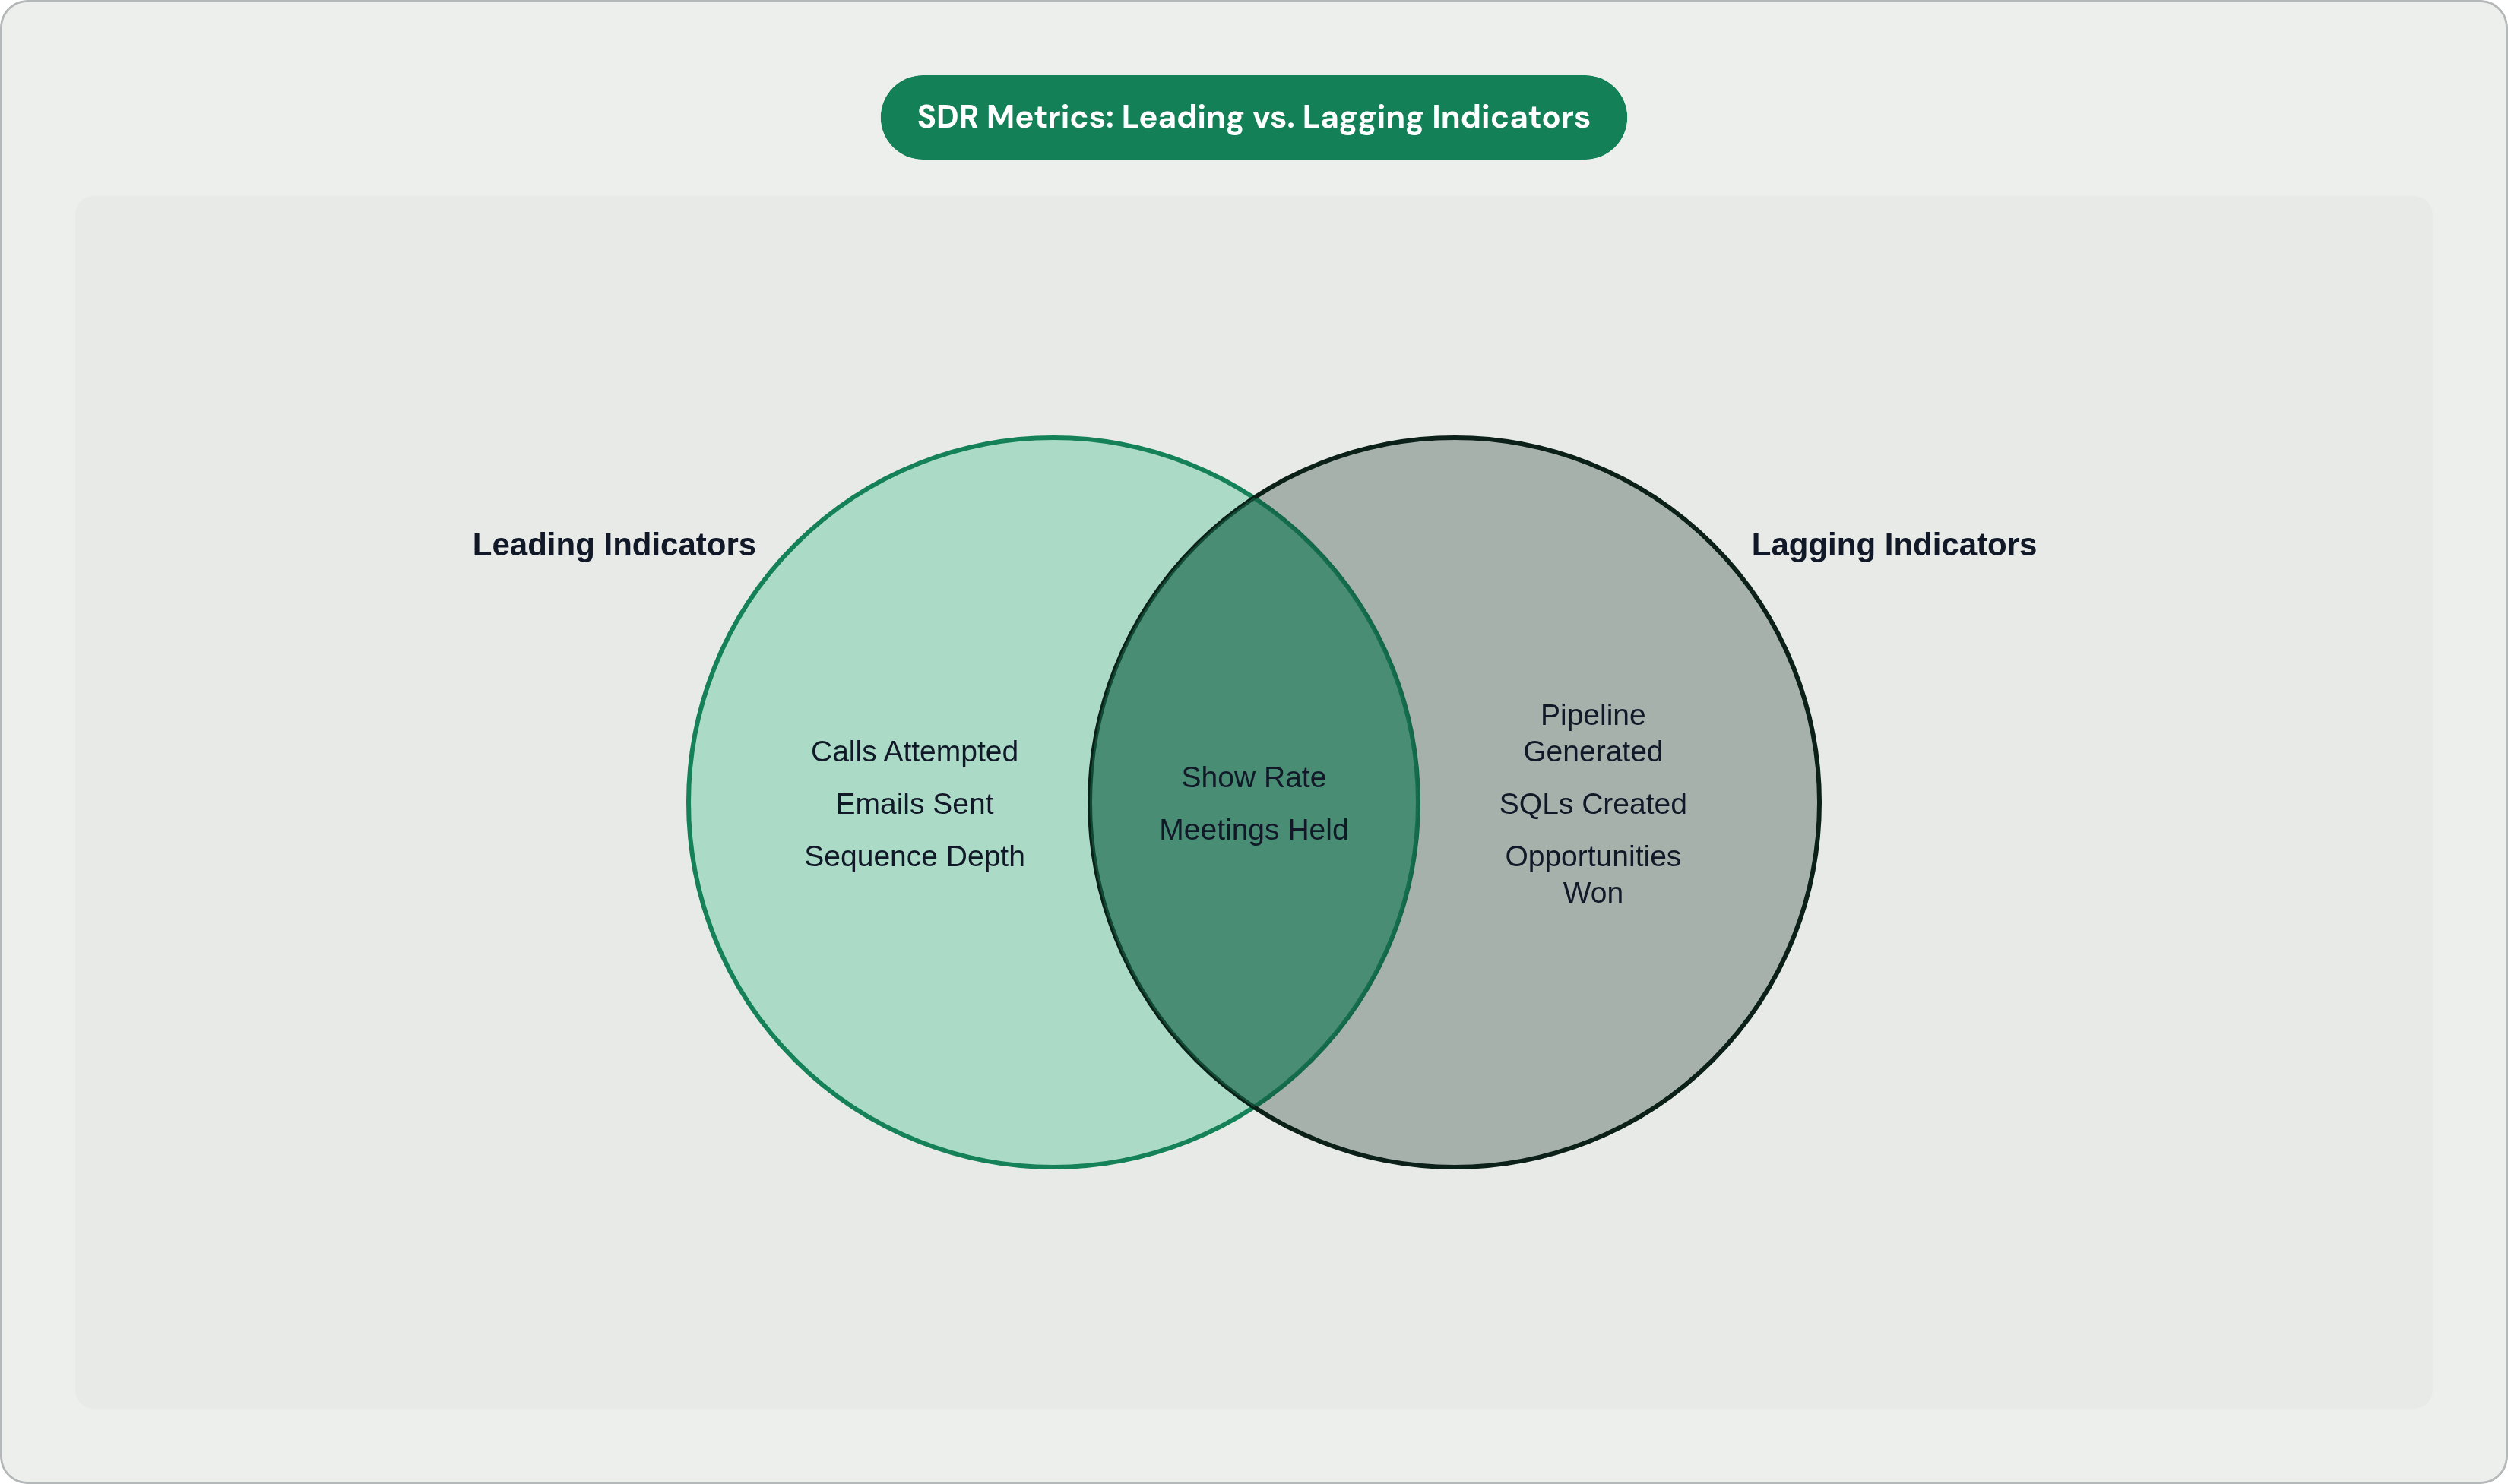
Every SDR metric falls into one of two buckets.
Leading indicators (inputs). These are the things reps control day to day. Calls attempted, emails sent, social touches, touchpoints per account. They tell you what's happening right now.
Lagging indicators (outputs). Meetings held, SQLs, opportunities, pipeline generated. These tell you whether the inputs are working. The catch is they tell you late. By the time a lagging metric drops, the damage upstream already happened weeks ago.
Both matter. Together.
The common mistake on one end: teams obsess over activity volume without ever checking whether it converts downstream. Busy reps are not the same thing as productive reps. The common mistake on the other end: managers stare at pipeline numbers wondering why they're soft, but they haven't looked at connect rates or sequence depth in months. They're trying to fix a leak by mopping the floor instead of finding the pipe.
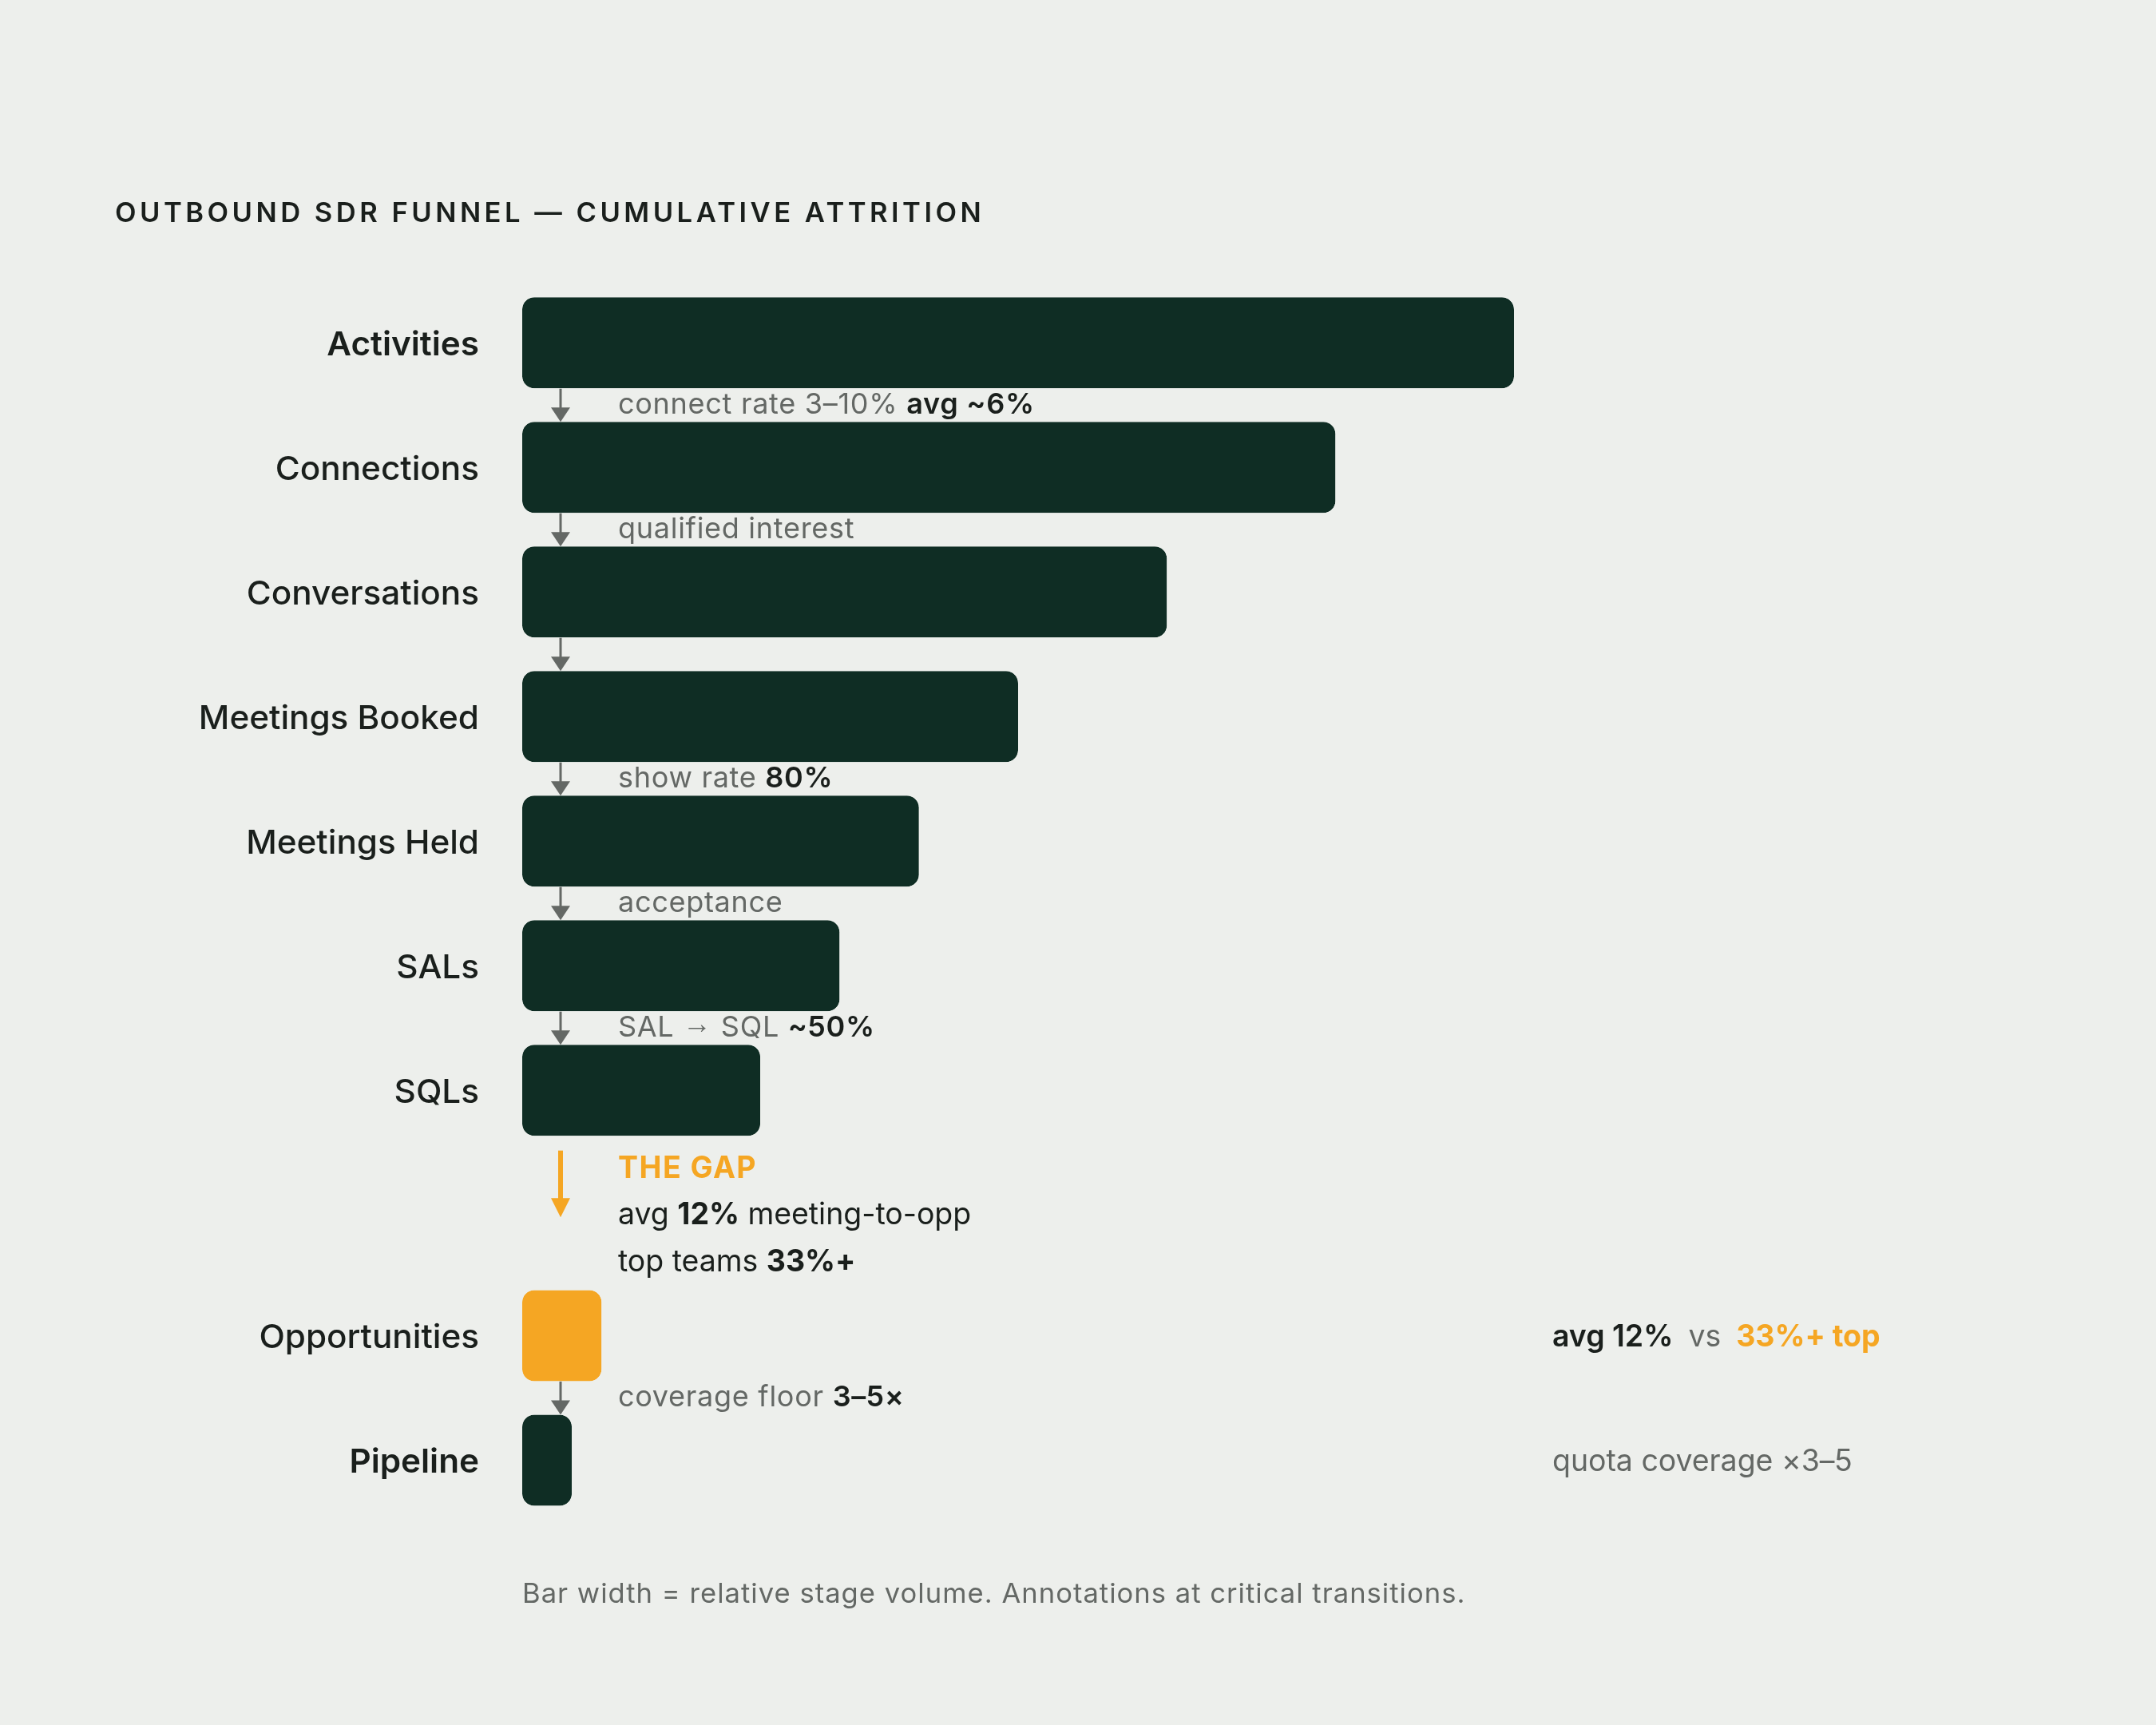
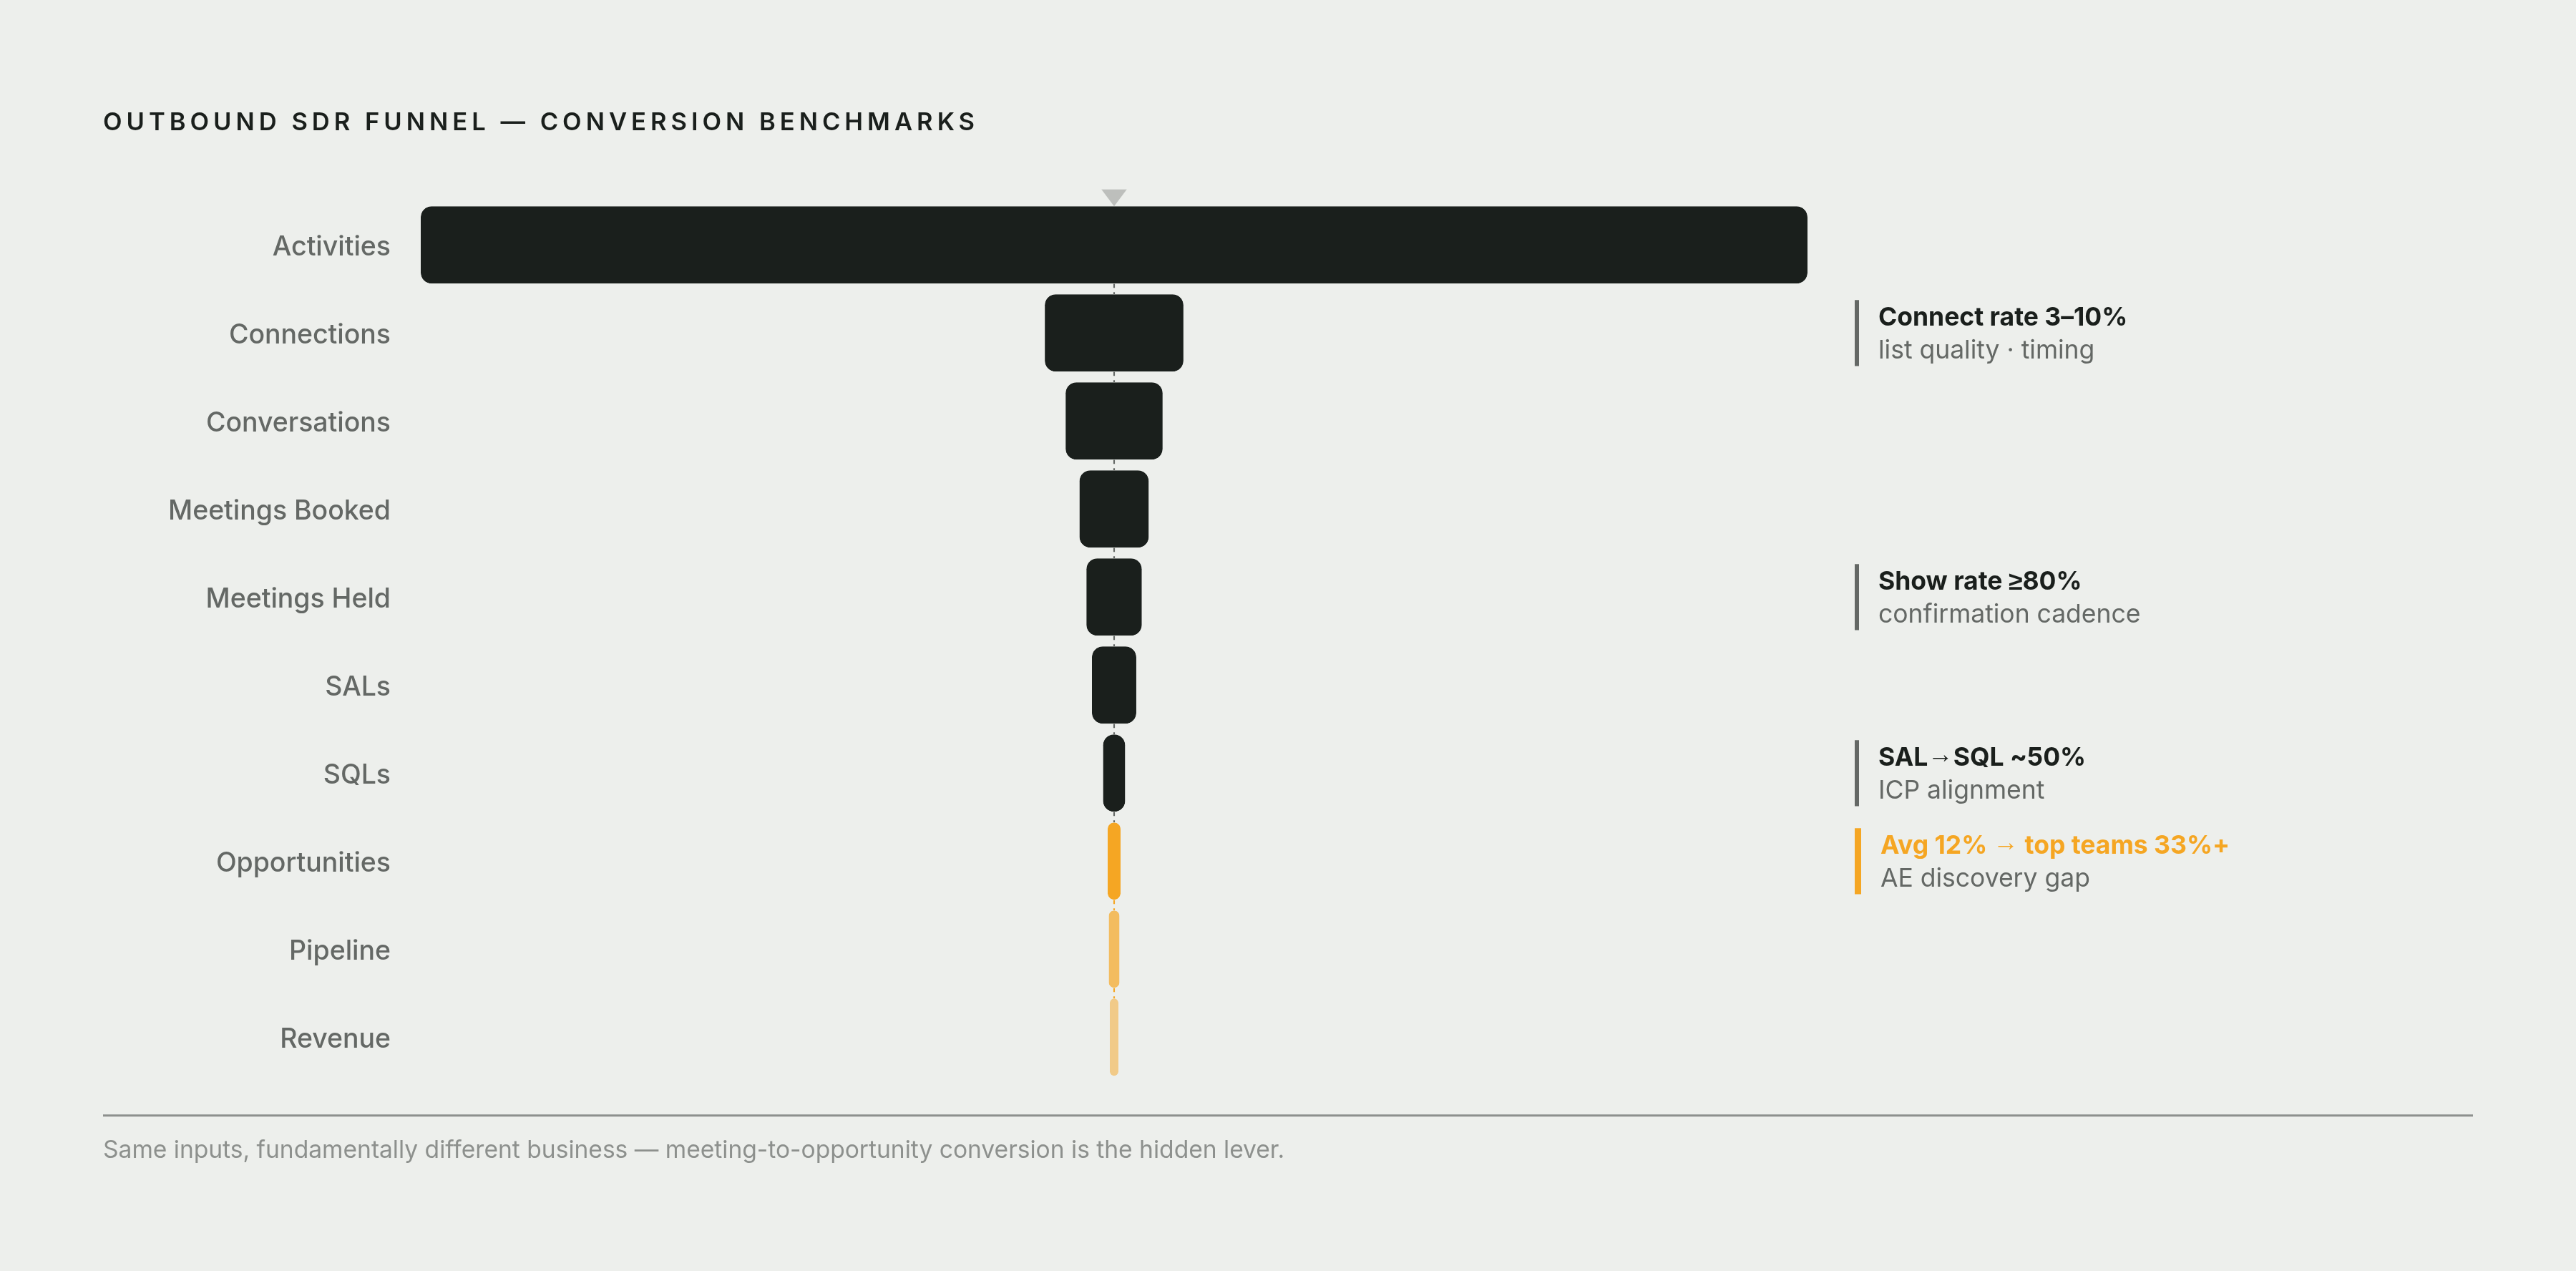
Here's the funnel shape to keep in mind throughout this piece:
Activities → Connections → Conversations → Meetings Booked → Meetings Held → SALs → SQLs → Opportunities → Pipeline → Revenue
A failure at any stage can look identical on a surface-level dashboard. A rep with 10 meetings booked could have a connect rate problem, a sequence depth problem, a list quality problem, or a show rate problem. You can't tell from the meeting number alone.
That's the point. Each section below covers one stage or transition. The goal is to show how a crack at one stage becomes a flood two stages later.
Daily Activity Volume: What the Averages Say and Where They Mislead
The average outbound SDR logs roughly 94 activities per day across calls, emails, voicemails, and social touches, per SalesSo's 2025 data. Typical benchmarks sit at 40 to 50 calls and 10 to 40 emails per day for outbound roles.
Those numbers sound reassuring. They are also almost entirely useless on their own.
Here's why. High-activity reps and low-activity reps often produce nearly identical pipeline when sequencing and targeting are weak. Volume without precision is just noise, delivered at scale.
Account load is one of the clearest examples. A healthy range is 75 to 125 active accounts per rep at any given time. Reps carrying 300-plus accounts aren't doing deeper work across fewer accounts. They're spreading so thin that no account ever gets a meaningful sequence. Everything gets one or two touches and dies quietly.
Then there's the admin problem. Salesforce's 2024 data found that reps spend only 28 to 30% of their week on revenue-generating activities. Roughly 41% of the average day gets consumed by administrative tasks, which works out to about two hours per day of actual selling. Two hours.
So when a manager looks at 94 logged activities and thinks "good, they're busy," the question worth asking is: busy doing what, exactly?
What to actually track here: Calls attempted, emails sent, social touches, and voicemails. Broken out by channel. Not lumped into a single "activities" number that tells you nothing about what kind of work is actually happening.
Sequence Depth and Multichannel Coverage Per Prospect
The "three emails and a call" cadence isn't a strategy. It's a way to feel like you're prospecting while doing the bare minimum.
Here's a stat that should permanently retire that approach. Research consistently shows that 44% of reps stop after one or two touches. But conversions concentrate at touch five and beyond. Gartner has put the number of dials needed just to connect with a prospect at 18 or more.
So roughly half of SDRs are quitting before the game even starts.
Modern, effective cadences stretch across multiple weeks and multiple channels. Phone, email, LinkedIn, direct mail in some cases. The teams running three-plus channels see dramatically higher response rates compared to single-channel outreach. Not a small lift. The kind of lift that makes single-channel outreach look like a waste of the list you paid for.
But what if your team is sequencing correctly on paper, but the numbers still aren't moving? That's when you look at sequence depth data.
What to actually track here: Average touchpoints per prospect before retire. Channel mix per sequence. And the percentage of prospects who reach touch five or beyond before being marked dead.
The red flag to surface: if the majority of your retired leads never made it past touch two, the problem is sequence discipline. Not market interest. The prospects didn't say no. Your reps just stopped asking.
Cold Call Connect Rate: The Metric That Exposes List Quality and Timing
Connect rates have dropped sharply over the past several years. Most teams now operate in the 3 to 10% range, with around 6% as a rough midpoint.
The benchmarks do shift meaningfully by segment. Enterprise B2B technology typically lands at 5 to 7%, given the layers of gatekeepers involved. Mid-market B2B has a healthier standard around 8 to 12%. Small business and high-volume markets can get to 12 to 15% when the list is tight.
Reps now need roughly 21 attempts per contact, up from 17 in recent years. And 93% of conversations happen by attempt eight, which tells you something important about persistence distribution.
Here's the thing most teams miss about connect rate. A low connect rate tends to point to list quality, calling time, or both. Not rep skill. Not pitch quality. The rep isn't even getting to the pitch.
It's worth separating two very different problems that often get lumped together. The first is whether prospects are picking up. That's connect rate. The second is what happens once they do. Per Prospeo's analysis of more than 204,000 calls, the conversation success rate once someone answers sits at 65.6%. Once you're talking to a live human being, the odds flip dramatically in your favor.
So if connect rate is low, don't retrain the pitch. Fix the list and the calling windows.
What to actually track here: Connect rate, expressed as connects divided by dials. Broken out by list segment and time-of-day bucket. That breakdown is how you find whether the fix is a targeting problem, a timing problem, or both.
Cold Email Reply Rate: Interpreting a Number That Varies Wildly by Methodology
Published reply rate benchmarks range from under 1% for strict net-new cold outreach (per Belkins' 2025 analysis) to the low-to-mid single digits depending on dataset and methodology.
Before you panic or celebrate about where your rate lands, the more important question is: which definition are you using?
There are three separate email metrics that most teams squash into one number, and it costs them diagnostic clarity.
- Reply rate (all replies / delivered). This is a health signal for subject lines and deliverability.
- Positive reply rate. This is a quality signal for targeting and message relevance.
- Meetings booked from email. This is the only number that actually ties email activity to revenue output.
A team can have a high reply rate full of "remove me from your list" responses. That's not a win. Conversely, a team can have a very low reply rate that's nearly all positive interest. Context changes everything.
Personalization is the highest-leverage variable here. Going beyond first-name tokens and actually referencing something specific to the prospect. A role change, a company announcement, a shared context. The lift in reply rate from real personalization versus surface personalization is significant, and it comes from relevance, not volume.
One more counterintuitive point worth sitting with: smaller, more targeted campaigns consistently outperform large blasts on response rate. The implication for SDRs is that list segmentation and message specificity matter more than send volume. More sends can actually mean fewer responses, proportionally, if the targeting is loose.
What to actually track here: Reply rate, positive reply rate, and meetings booked per 100 emails sent. All three, together. If you only track the top-line reply number, you're flying partially blind.
Meetings Booked and Meeting Show Rate: Where Prospecting Effort Either Converts or Evaporates
Per Operatix's study of 150 SDRs across SaaS verticals, the benchmark is 15 meetings booked per month per outbound SDR. Factor in a standard no-show rate of around 20%, and you're looking at 12 meetings actually held. That's the number that feeds AE calendars and starts filling pipeline.
Top performers consistently exceed 20 booked meetings per month. The gap between average and top performers is largely explained by sequence depth and data quality. Not raw call volume.
Now, show rate. This one deserves more attention than it gets.
Eighty percent is the benchmark. Below that, every lost point represents a prospect who agreed to talk and then didn't. That's confirmed interest that evaporated. And low show rate is rarely a prospect intent problem. It's more often a confirmation cadence problem.
The fix is specific: a same-day reminder plus a morning-of touchpoint before the meeting. Not more prospecting volume. Not a better opener. A logistical nudge.
Here's a way to make the stakes concrete. A fully-loaded SDR costs around $130,000 per year. At an output of 8 to 10 qualified meetings per month, the effective cost per held meeting runs between roughly $1,083 and $1,354. Every no-show is a four-figure line item. It's not an abstract miss. It's a real dollar figure that most teams never bother to calculate.
What to actually track here: Meetings booked, meetings held, and show rate. Tracked separately. If held meetings drop, you need to know whether you have a booking problem or a confirmation problem. They have different fixes.
SAL-to-SQL Conversion: Where SDR and AE Judgment Meet
A quick definitional checkpoint, because this one trips up a lot of teams.
A Sales Accepted Lead (SAL) is a meeting the AE agreed to take. A Sales Qualified Lead (SQL) is one the AE confirmed has real opportunity potential after that first conversation. One is a scheduling win. The other is a judgment call.
Per SalesSo's 2025 benchmark data, the SAL-to-SQL conversion rate benchmark sits at roughly half.
When that number falls below benchmark, it usually signals one of three things.
- SDRs are booking meetings with prospects who don't fit ICP in order to hit their meeting quota.
- SDR and AE teams are working from different implicit definitions of "qualified."
- Discovery on the SDR side is too shallow to surface disqualifiers before the meeting ever gets booked.
This metric is the clearest signal of SDR-AE alignment. Or the absence of it.
Teams with shared CRM dashboards and aligned lead definitions convert meetings to opportunities at significantly higher rates than siloed organizations, per Gradient Works' 2025 research. That's not a surprising finding. But it does confirm that the fix here is structural, not motivational.
What to actually track here: SAL-to-SQL rate by SDR and by AE, not just at the team level. Variation by rep is diagnostic. If one SDR's meetings consistently fail to convert to SQL, that's a booking quality problem. If one AE's inbound consistently underperforms, that's a handoff or discovery problem. You can't see that distinction at the aggregate level.
Meeting-to-Opportunity Rate and Pipeline Coverage: The Metrics AEs and Managers Actually Run the Business On
Meeting-to-opportunity rate is the conversion that determines whether SDR output is feeding sellable pipeline or just filling calendars.
Top teams maintain a lead-to-opportunity conversion rate well above a third, per Tendril's benchmark data. The average across SaaS companies is roughly 12%. That gap is wide enough to represent a fundamentally different business. Same inputs, radically different outcomes.
When meeting-to-opportunity rate is low after a healthy SAL-to-SQL rate, the problem is usually AE discovery or qualification. Not SDR targeting. The SDR got the right person in the room. What happened next is on the AE side.
Then there's pipeline coverage ratio. Pipeline generated divided by quota target. The minimum benchmark is 3 to 5x coverage. Top teams maintain 4 to 5x.
Below 3x, natural attrition across deal stages makes quota mathematically unlikely, even with strong execution from here. A quick example: a quota with pipeline at exactly 3x is 3x coverage. That's the floor, not the goal. If you're at 2x, you're not behind on execution. You're behind on math.
What to actually track here: Meeting-to-opportunity rate, pipeline generated per SDR (benchmarked against the Bridge Group's median of $3 million annually for SaaS), and pipeline coverage ratio at the team level. These three together tell you whether the SDR program is generating sellable business or just generating motion.
Pipeline Generated Per SDR: The Output Metric That Ties Everything Upstream Together
Per Bridge Group research across hundreds of B2B sales development teams, the median annual pipeline generated per SDR in SaaS is $3 million.
The range is wide. Some teams fall below $750,000 per SDR annually. The high end exceeds $10 million. That spread doesn't reflect rep effort differences alone. It reflects how healthy the upstream metrics are.
ACV shapes the absolute number in ways that matter for benchmarking. Per TOPO research, lower-ACV companies (under $25,000 deal size) see SDRs generating around $191,000 in pipeline per month. Higher-ACV companies generate $600,000 to $700,000 per month per SDR. So before you benchmark your number against anything, make sure you're comparing against the right cohort.
SDR-sourced pipeline represents anywhere from 46 to 73% of total outbound pipeline at most B2B companies. That makes this metric the most direct line between SDR program health and revenue.
But here's the diagnostic trap. Pipeline per SDR is a lagging metric. By the time it drops, you've already lost weeks. The upstream metrics exist precisely to catch the problem before it shows up here.
So when pipeline per SDR falls below benchmark, here's how to work backward.
- Is meeting-to-opportunity rate low? SAL/SQL definition problem, or an AE issue.
- Is show rate low? Confirmation cadence problem.
- Are meetings booked below 15 per month? Sequence depth or connect rate problem.
- Is connect rate low? List quality or timing problem.
- Is activity volume low? Admin burden or account load problem.
Each question sends you one level further upstream, to the specific stage where the leak actually is.
How to Build a Dashboard That Surfaces the Right Problem at the Right Stage
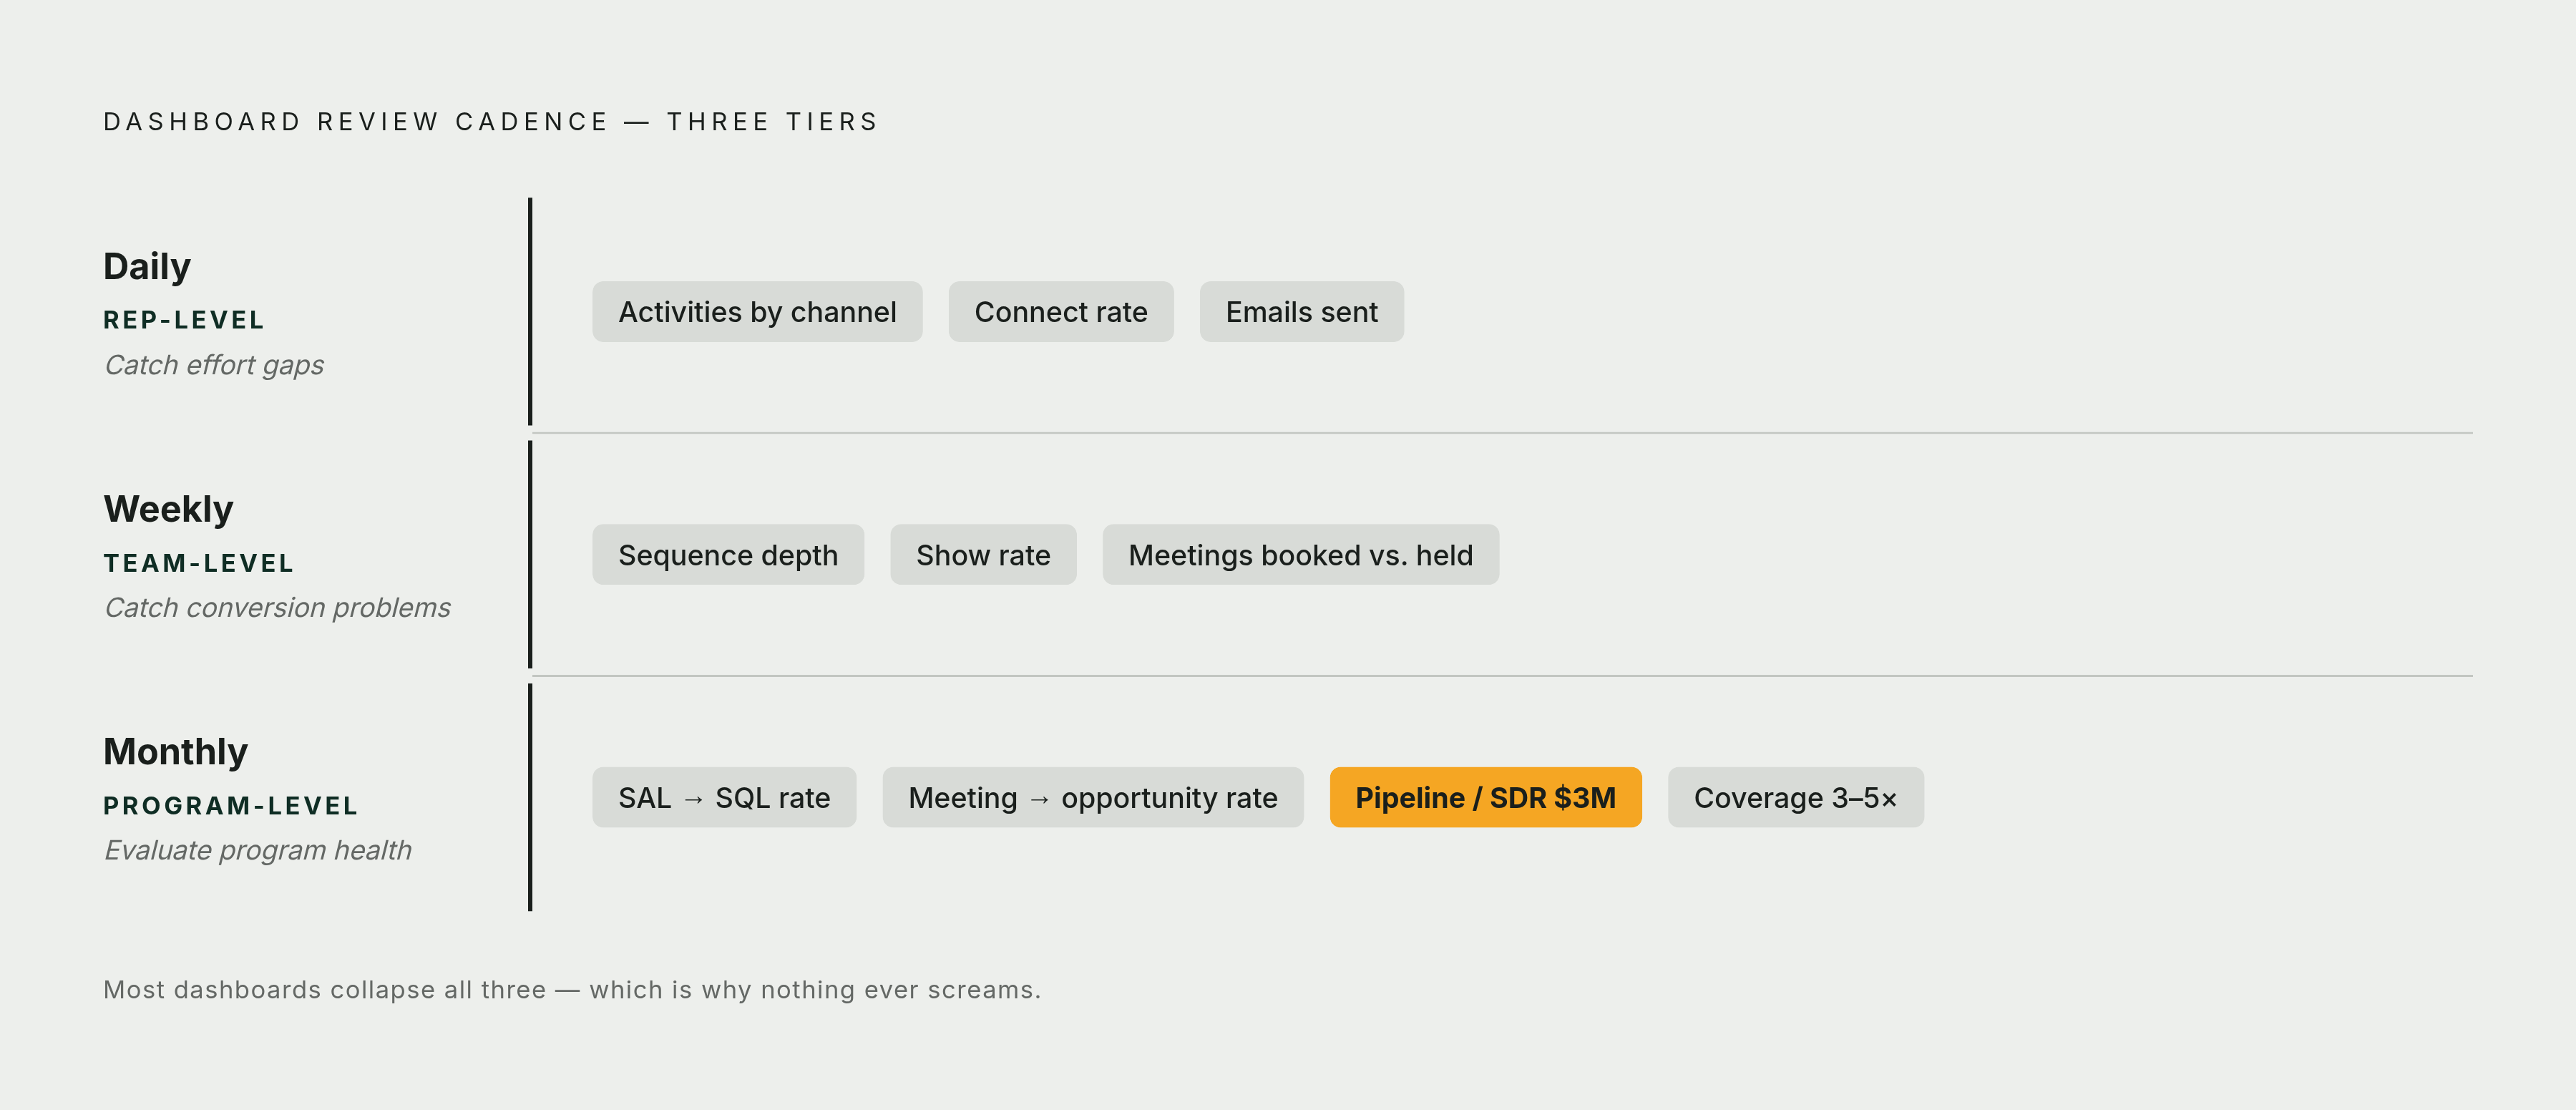
Most SDR dashboards make the same mistake. They show all metrics at equal weight, which means everything looks like a monitoring exercise. Nothing screams. Nothing guides action.
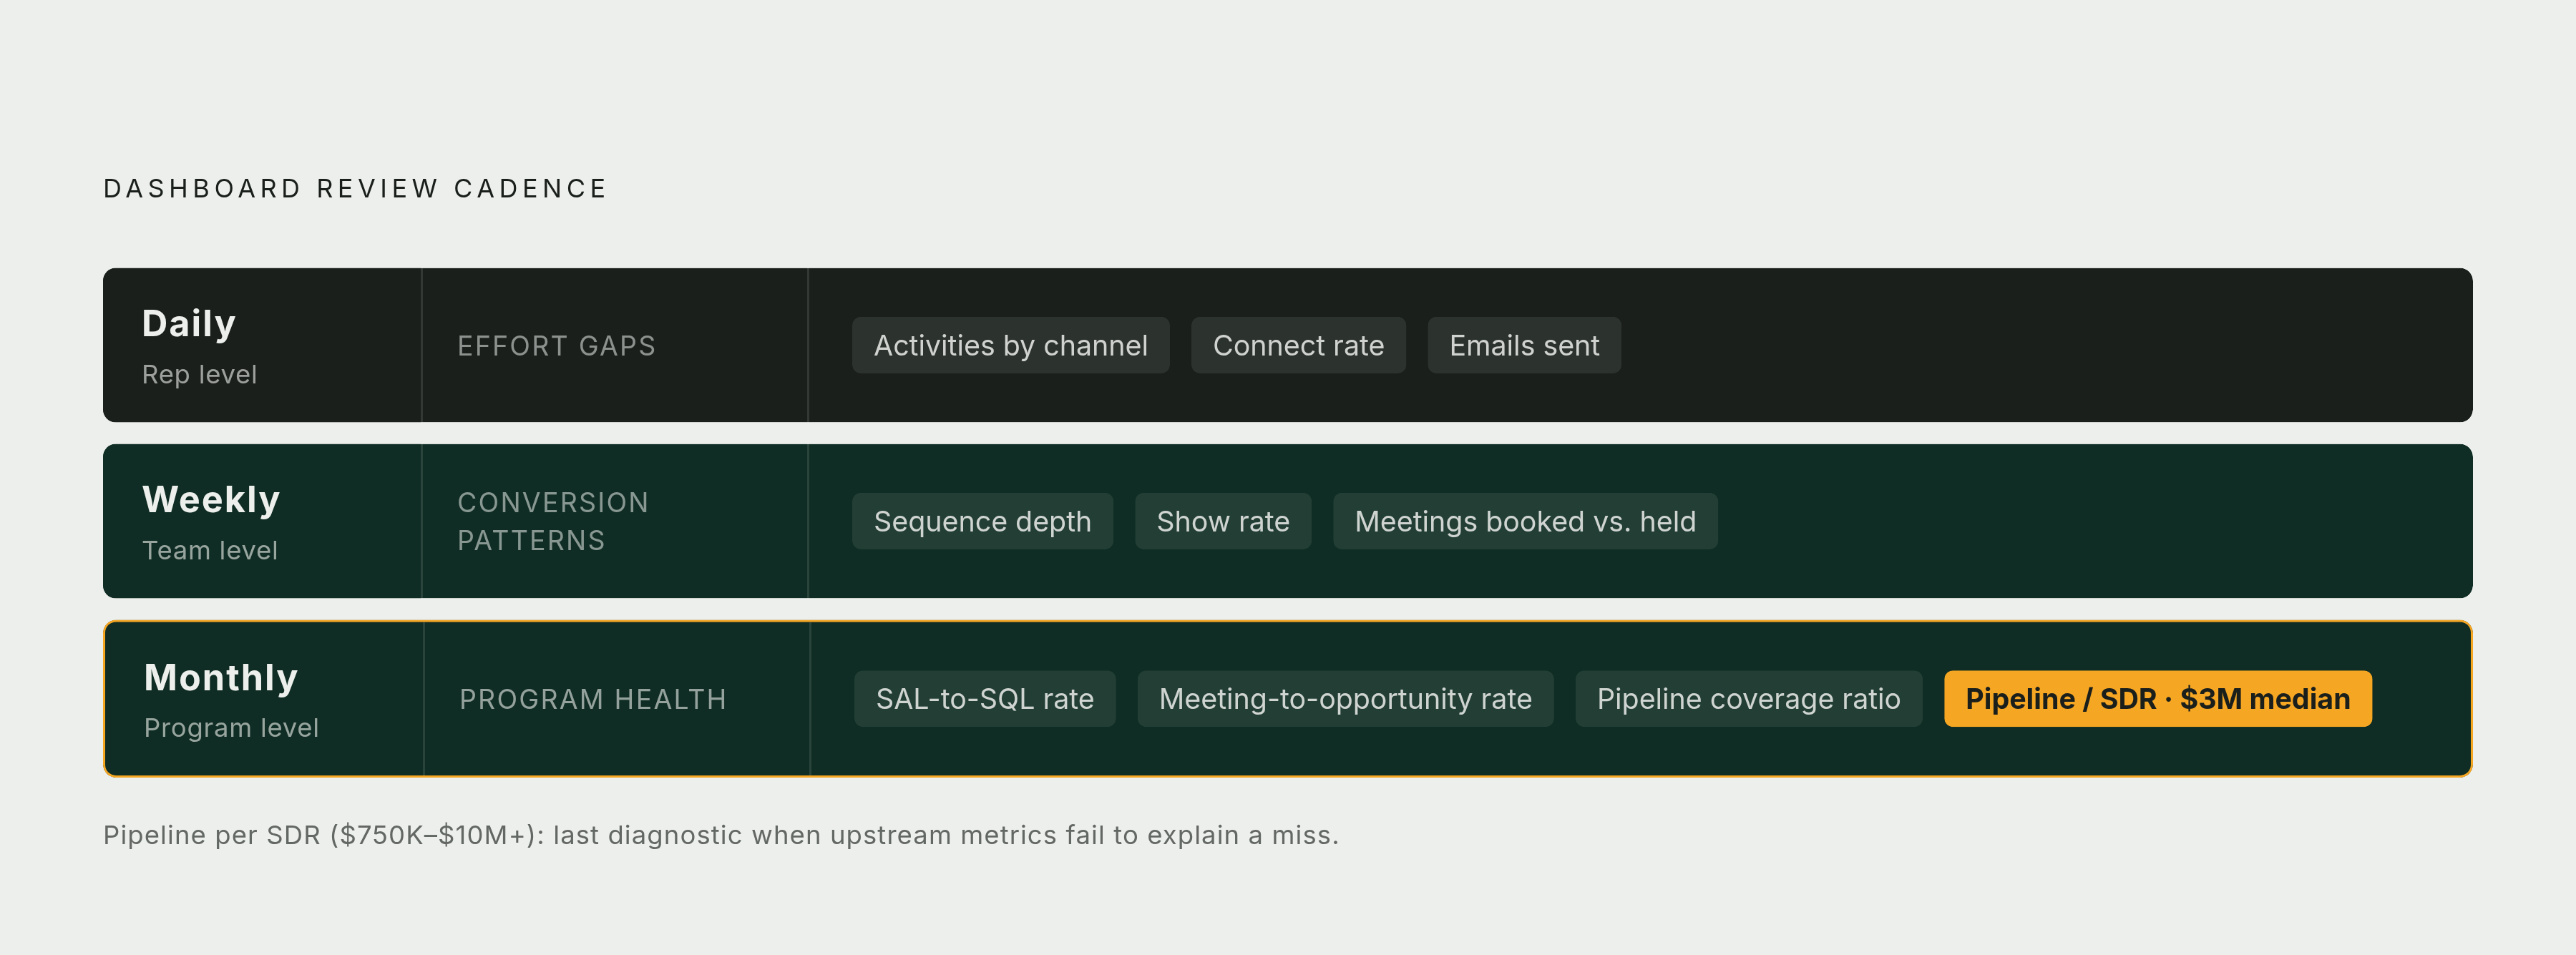
A useful SDR dashboard has three layers, each with a different audience and a different cadence.
Daily review (rep-level): Activities by channel, connect rate, emails sent. The inputs the rep directly controls. This layer is for reps and frontline managers to catch effort gaps before they become result gaps.
Weekly review (team-level): Sequence depth, show rate, meetings booked versus held. This is where conversion patterns emerge. A rep can be logging the right activity volume and still have a sequence depth problem that only shows up when you look at touchpoints per retired prospect.
Monthly review (program-level): SAL-to-SQL rate, meeting-to-opportunity rate, pipeline generated per SDR, pipeline coverage ratio. This is where you evaluate whether the program is producing sellable business, not just motion.
The structure matters because the problem at each layer requires a different fix. An activity volume problem gets solved with accountability and admin reduction. A show rate problem gets solved with a confirmation cadence. A SAL-to-SQL problem gets solved with alignment conversations between SDR and AE leadership. Throwing the same solution at every problem is why most performance interventions don't work.
One practical note. When pipeline drops and you pull up the dashboard, resist the instinct to start at the bottom. Start at the top. Work down from activity inputs to connection rates to sequence depth to meeting quality to pipeline. The problem is more often upstream from where it shows up.
The whole point of building a connected funnel view is to kill the guessing game. Quota misses aren't random. They're traceable. And if you can trace them, you can fix them.
That's a better starting point than hoping next quarter looks different.