Pipeline Coverage Ratios and What They Mean for Forecast Accuracy
Outdated benchmarks are hiding forecast gaps that show up as missed quarters.

Pipeline coverage ratio is one number: total value of qualified open deals, divided by the revenue target for the period. Quota's $1 million, open qualified pipeline sits at $3 million; coverage is 3x. The catch is in that one word: qualified. Raw pipeline volume is not coverage. A ratio built on deals that shouldn't have entered the pipeline in the first place is just a bigger, more confident-looking wrong answer.
Here's what the ratio can tell you: does current pipeline hold enough revenue to hit the number, assuming deals close at normal rates? Here's what it leaves out on its own: which deals actually close, how quality varies across that pipeline, or whether "normal" conversion still means what it used to mean.
Two things get mashed together that shouldn't be. Pipeline coverage is a snapshot: total open pipeline against quota, at a point in time. Forecast coverage applies win rates to that pipeline to estimate expected revenue. One is a picture. The other is a prediction built from that picture. Mixing them up is how a team ends up confident about a number that was not built to predict anything.
How the weighted variant makes the ratio meaningfully more accurate
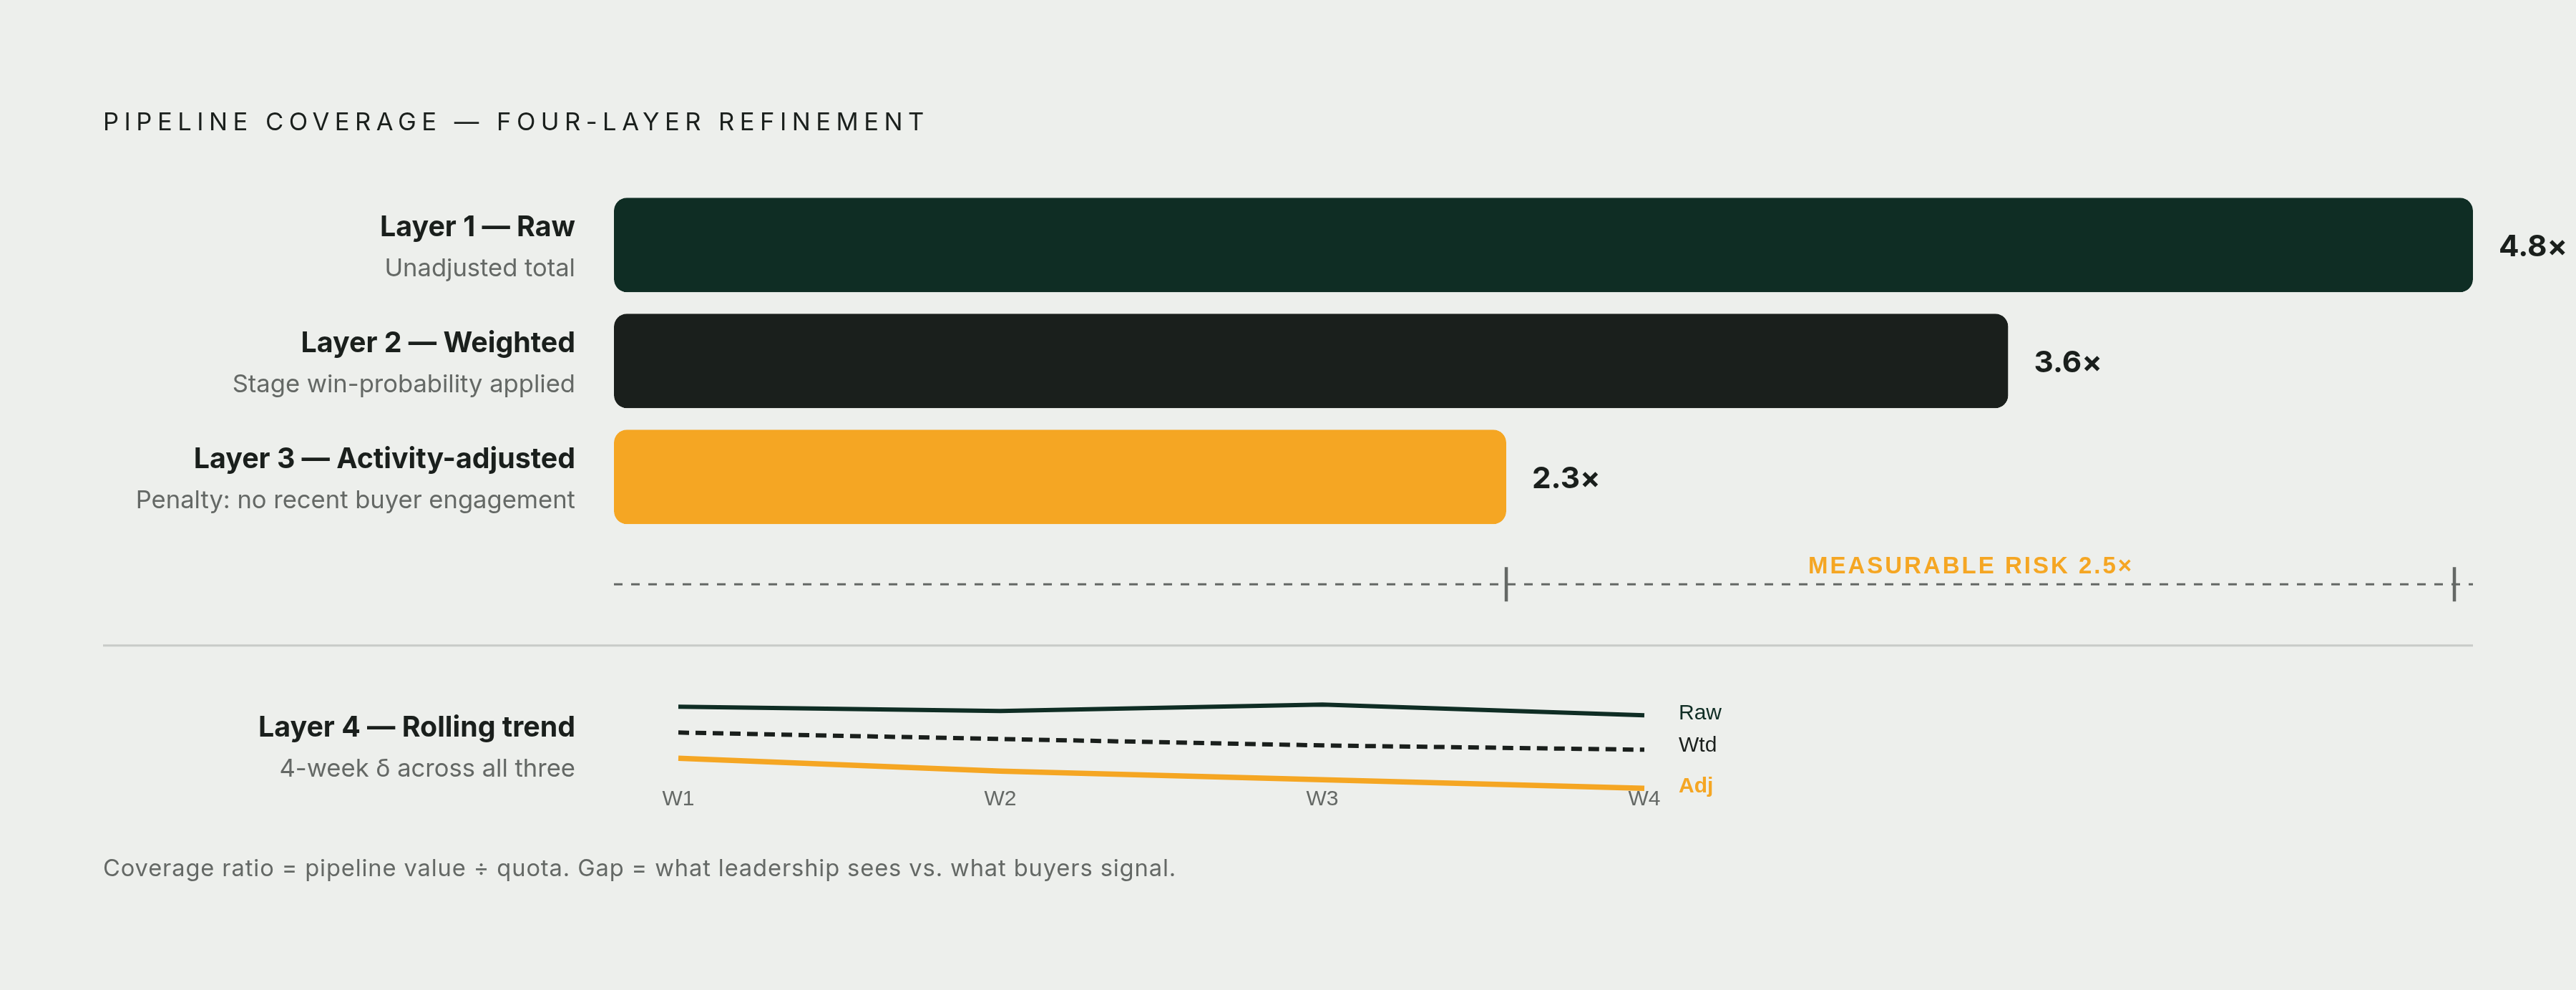
Raw coverage treats every open deal the same. A $100,000 deal that just entered discovery counts exactly as much as a $100,000 deal sitting in final proposal with a signature pending. That's backwards, and it's the flaw worth fixing before touching anything else about how coverage gets measured. Weighted coverage fixes it by multiplying each deal's value by its probability of closing, based on stage, historical win rates, or a model's prediction.
So a $100,000 proposal-stage deal, multiplied by its stage-based close probability, contributes only a fraction of its face value to weighted pipeline, not the full $100,000.
Build it out in layers:
- Layer 1: Raw coverage by segment. The top-line number, unadjusted.
- Layer 2: Weighted coverage by segment, using stage-based win probabilities.
- Layer 3: Activity-adjusted coverage. Weighted coverage with a penalty for deals showing no recent buyer engagement.
- Layer 4: A rolling trend comparing all three measures over a four-week window, to see direction, not just a single point.
The gap between Layer 1 and Layer 3 is the measurable risk sitting inside the forecast: the number leadership sees on a slide versus the number that reflects what's actually happening in accounts. There's no single correct method here. Which layers matter most depends on how much deal-level data exists and how far along the forecasting process already is.
Why the 3x rule of thumb no longer holds for most B2B teams
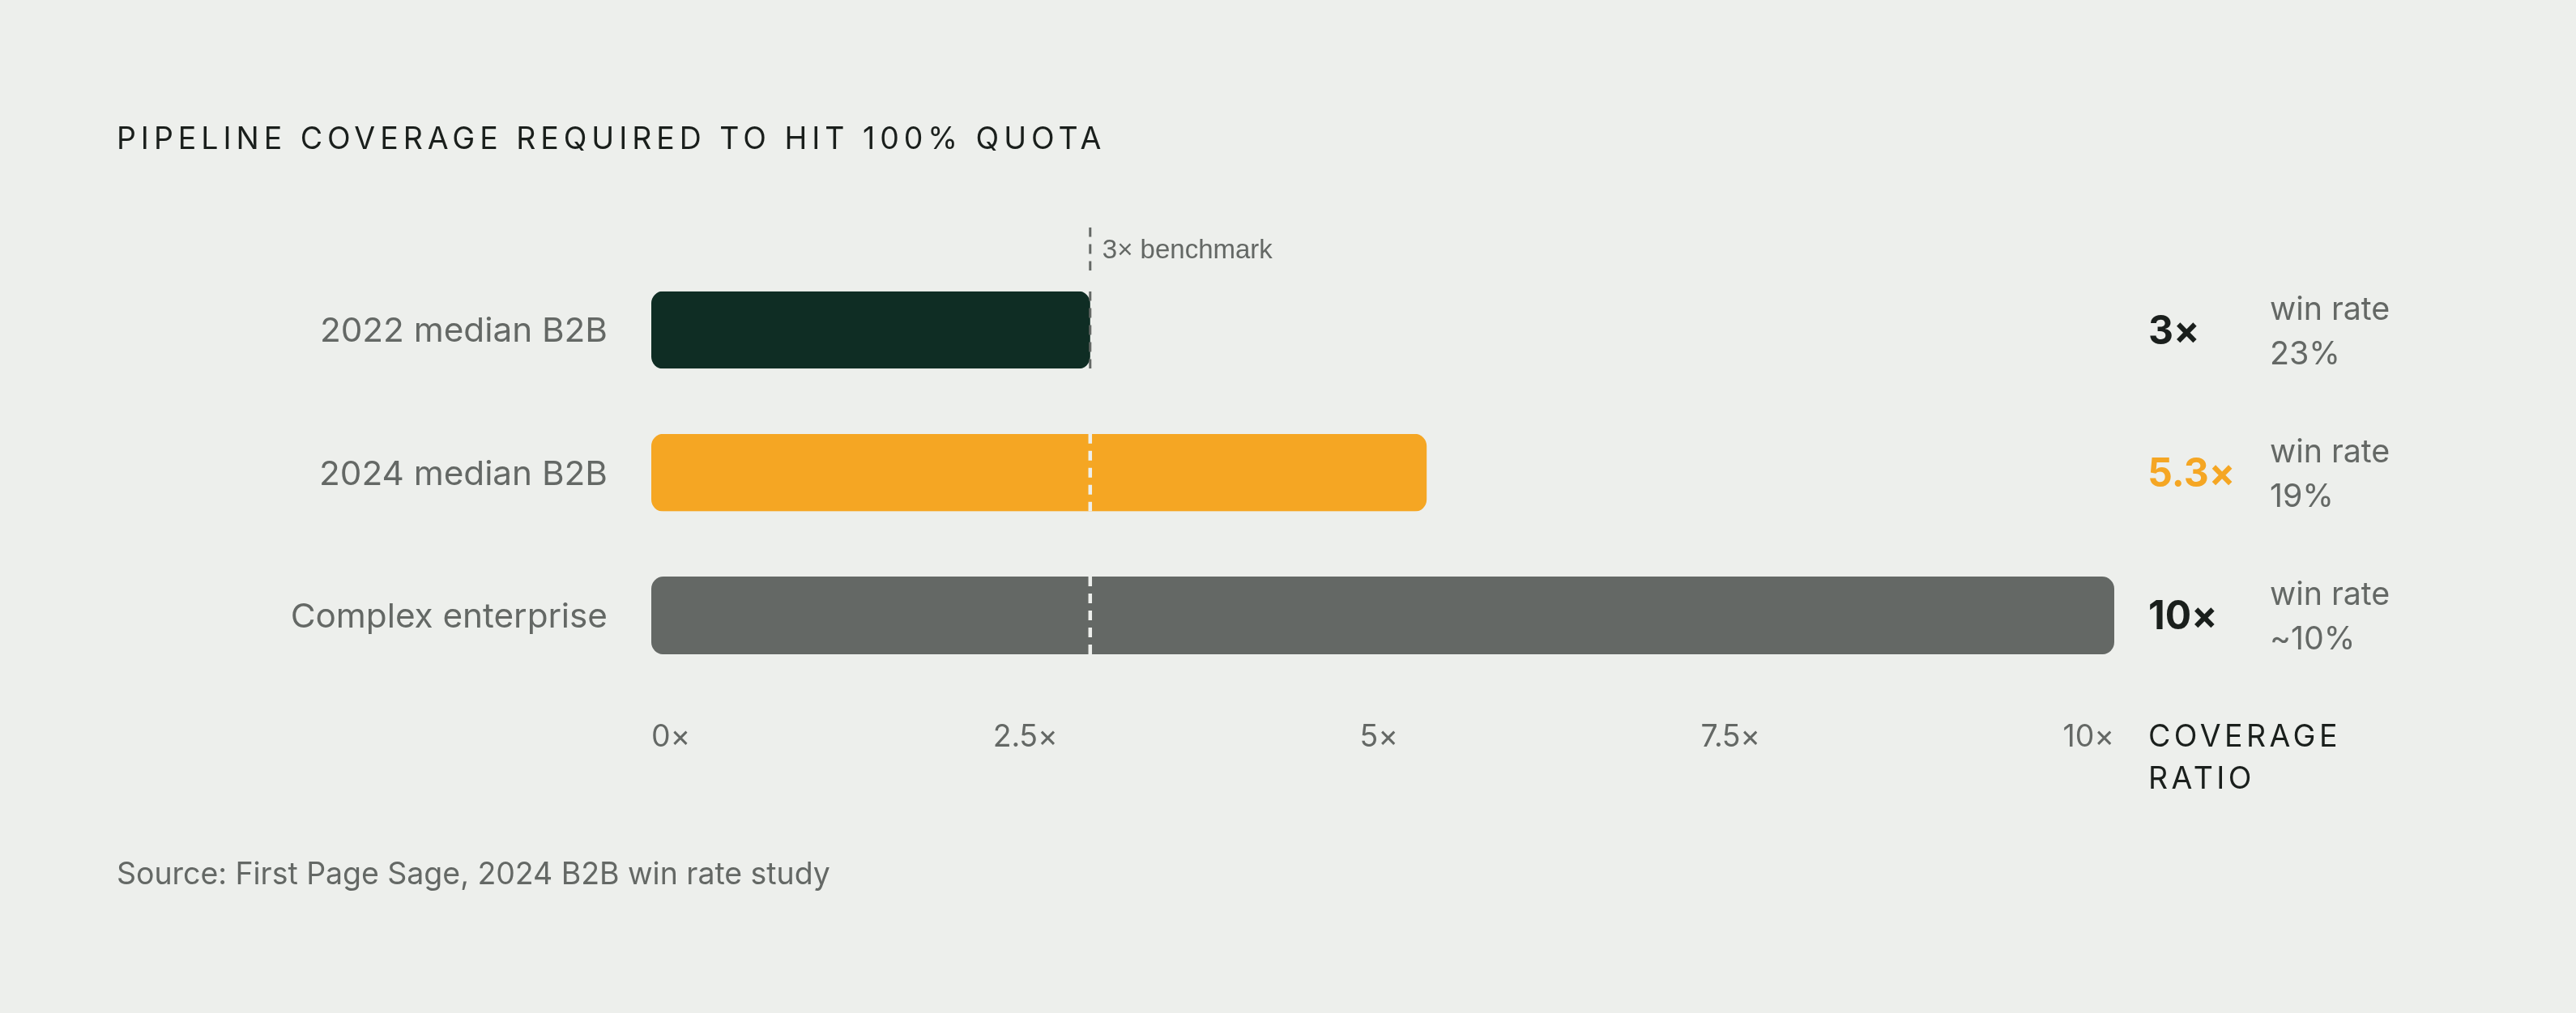
The 3x benchmark wasn't pulled out of thin air. At a roughly one-in-three win rate, 3x coverage statistically delivers 100% of quota. That math worked in 2022. It doesn't work now, and most teams still running on it don't know that's the reason their forecasts keep missing.
The win rate underneath the rule moved, and the rule of thumb stayed put. Median B2B win rate was 23% in 2022; by 2024, per First Page Sage, it had dropped to 19%. At a 19% win rate, breaking even requires 5.3x raw coverage, not 3x. Teams still running the 3x playbook are working with a target that's roughly half of what the math calls for. That's a team walking into the quarter already behind, and not knowing it.
Segment matters too, and treating all B2B pipeline as one bucket is where most of this goes wrong. First Page Sage's 2025 data shows enterprise deals above $100K in annual contract value closing at 15-20%, while SMB deals under $25K close at 30-40%. Enterprise teams with win rates in the 15-25% range need 4x to 7x coverage to forecast with any real confidence. Push into complex enterprise sales with win rates as low as 10%, and a 10x ratio is often what's actually necessary. A flat 3x target applied across SMB and enterprise alike is treating two different businesses as if they run on the same math. They don't.
Sales cycles are making this worse, not better. The Ebsta/Pavilion 2025 B2B Sales Benchmark Report found average cycles lengthened 12% year-over-year, while win rates fell from 21% to 18% over the same stretch. Put those together and the pipeline sitting in the CRM today will take longer to convert than the pipeline that trained the old benchmarks. Coverage snapshots built on outdated velocity assumptions overestimate what's coming.
Add more people to the buying process and the friction compounds. Gartner found the average B2B deal now involves 6.8 stakeholders, up from 5.4 in 2020. The Forrester SaaS Purchase Survey found CFO involvement in software purchases up 40%. More stakeholders means more places for a deal to stall, and stalling stays mostly invisible in a raw coverage number. It shows up later, as a miss.
Segment-specific coverage targets that reflect current conversion realities
So what's the actual target, if 3x is stale across the board? The Optifai Sales Ops Benchmark, covering 939 companies, gives a range by segment:
- SMB: 2.5x to 3x
- Mid-Market: 3x to 4x
- Enterprise: 4x to 5x
These ranges assume a reasonably healthy win rate for the segment. Teams performing below their segment's average win rate should aim for the high end, or above it.
Two thresholds are worth flagging. Below 2x, quota is at real risk, especially given how often deals slip in B2B selling. Above 6x, the number is usually not a sign of strength: a ratio that high is often a qualification problem wearing a good-news costume, which the next section digs into.
None of these ranges should get borrowed wholesale, though. The right target comes from a team's own historical win rate and quota, not another company's playbook. And there's a structural wrinkle worth factoring in: quota attainment has been sliding. Only 28% of reps hit quota per the Ebsta x Pavilion 2024 B2B Sales Benchmarks, and separate industry tracking put quota attainment at 46% by early 2025. Many organizations are known to set quotas that exceed what their pipeline math can realistically support. If the quotas themselves are set too high, coverage targets built against those quotas may need to move upward again just to compensate.
How raw coverage numbers hide pipeline quality problems
A 3x ratio sounds fine until someone asks what's actually sitting in the numerator.
Start with fit. Industry research consistently finds that a significant share of pipeline at many organizations is made up of accounts that don't match the ideal customer profile. A 3x ratio built mostly on deals that don't match the ideal customer profile isn't really 3x qualified coverage. Most of what's counted may close rarely, no matter how hard reps work it.
Stage distribution adds another layer of distortion. A Stage 1 deal and a Stage 4 deal carry equal weight in raw coverage, despite having very different odds of closing this quarter. That's exactly what weighted coverage corrects, but plenty of teams still report and act on the raw number alone.
Deal age matters in a way raw coverage can't see. A deal parked at "Proposal" for 90 days, when the average proposal-to-close cycle runs 60 days, has a materially worse shot at closing than a proposal sent last week. Both look identical in a snapshot. That's the whole problem with a snapshot: it can't tell the difference between a deal that's moving and one that's stuck.
Then there's single-threading. Research on B2B sales consistently shows that deals with multiple engaged stakeholders close at substantially higher rates than those with only a single point of contact. A pipeline full of single-threaded deals is weaker than its headline number suggests, and no coverage math fixes a deal that only one person on the buying side even knows exists.
Lead source mix quietly does the same thing. Inbound deals tend to carry higher baseline close rates than outbound. Blend the two into a single coverage ratio, and a weak outbound pipeline hides behind a stronger inbound number.
The upshot: any coverage ratio reported without visibility into ICP fit, stage age, and stakeholder engagement is a number a team can look at but can't really act on.
When high coverage is actually a warning sign
Here's the part that trips people up: a high ratio isn't automatically good news. Unusually high ratios usually point to a problem, not a strength, and treating them as a win is the mistake worth naming directly.
A few usual suspects behind an inflated number:
- Ghost deals. Opportunities with little or no real buyer engagement that reps keep alive in the system rather than mark as lost, because closing pipeline feels like admitting failure.
- Stage stagnation. Deals stuck in the same stage well past the expected cycle length, still counted at full value.
- Lumpy pipeline. A handful of very large deals making up most of the coverage. Lose just one, and there isn't enough behind it to absorb the hit.
There's a resource cost buried in all of this too. A bloated pipeline eats up rep time and management attention on deals that were unlikely to close, time that could have gone toward opportunities that actually were winnable. Large deal concentration is its own structural risk on top of that: when a small number of deals represent most of the coverage value, the standard coverage math stops applying cleanly. More backup is needed than the ratio implies, because the ratio assumes deals are somewhat interchangeable, and they aren't.
The question worth asking any time coverage looks unusually strong: is the pipeline wide because deals are actually moving forward, or wide because nothing's being cleaned out?
What coverage ratios actually predict about forecast accuracy — and what breaks that link
Here's a number that should give any RevOps team pause: 81% of B2B companies missed a quarterly forecast in the past two years, and poor pipeline visibility is frequently a contributing factor.
There's a real relationship between coverage and forecast accuracy, when the inputs are sound. Teams with consistently high qualified coverage tend to land forecast accuracy above 90%, according to HubSpot. Teams running thin coverage see variance compound as they become dependent on a small number of individual deals closing on schedule.
Cadence matters as much as the number itself. Digital Bloom found companies tracking pipeline velocity weekly hit 87% forecast accuracy, compared to 52% for teams that tracked irregularly. That's a 35-point gap, driven by how often the number gets checked, not by anything about the pipeline itself. Which raises the real question: if checking more often closes a 35-point gap, why do so many teams still check once a quarter?
The link between coverage and forecast accuracy tends to break in a few specific spots:
- The win rate used to set the coverage target no longer matches current market conditions.
- Stale or unqualified deals inflate the top number without adding any real conversion probability underneath.
- Coverage gets measured once a quarter instead of tracked as it moves.
Fifty-seven percent of RevOps leaders named slipped deals as a major driver of revenue leak in recent industry research. That's exactly the kind of thing a well-monitored coverage trend should catch early, well before it turns into a missed quarter.
How to run coverage analysis in practice — inputs, cadence, and what to do when the number moves
Start by building the team's own target instead of borrowing someone else's benchmark. Take the actual historical win rate, average sales cycle length, and quota, and calculate the coverage ratio those numbers actually require. Recheck it at least once a quarter, since win rates and cycle lengths don't hold still.
From there, run all three layers side by side rather than picking one:
- Raw coverage for the top-line view leadership tracks.
- Weighted coverage for what's realistically expected to close.
- Activity-adjusted or quality-gated coverage, with stale and low-ICP deals stripped out.
Cadence is arguably the bigger lever than any single layer. Weekly tracking of pipeline velocity, not monthly or quarterly, is associated with substantially higher forecast accuracy — the difference between catching risk early and finding out at quarter close, when it's too late to do much about it.
When coverage drops below target mid-quarter, the fix depends on where the shortfall actually sits. If the distribution is skewed toward early stages, the top-line number can look fine while little of it closes in time. That calls for pushing existing deals forward, not piling on more top-of-funnel activity. If coverage is thin across the board, that's a sourcing problem, and no amount of deal coaching fixes a sourcing problem.
When coverage climbs to unusually high levels, skip the celebration and audit for ghost deals and stage stagnation first.
Underneath all of it sits a constraint that's easy to overlook: a coverage ratio is only as trustworthy as the CRM data behind it. Stage dates, close date discipline, and deal value hygiene decide whether the number means much at all. That's where a lot of the manual overhead creeps in. Reps updating fields by hand is exactly the kind of task that slips when a quarter gets busy. A deal sits at "Proposal" for three weeks past its close date because nobody moved it, and the coverage number never knows. Tools built to run alongside the CRM rather than replace it can close that gap: logging updates automatically, flagging deals that have gone quiet, surfacing stage movement as it happens. Tools that integrate with Salesforce and HubSpot keep deal context current without needing reps to manually update every field, so the coverage number calculated from that data reflects what's actually happening in the account, not what was true three weeks ago when someone last touched the record.