Sales Forecasting Models and When to Use Each
Picking the wrong forecasting model costs companies millions in missed accuracy.

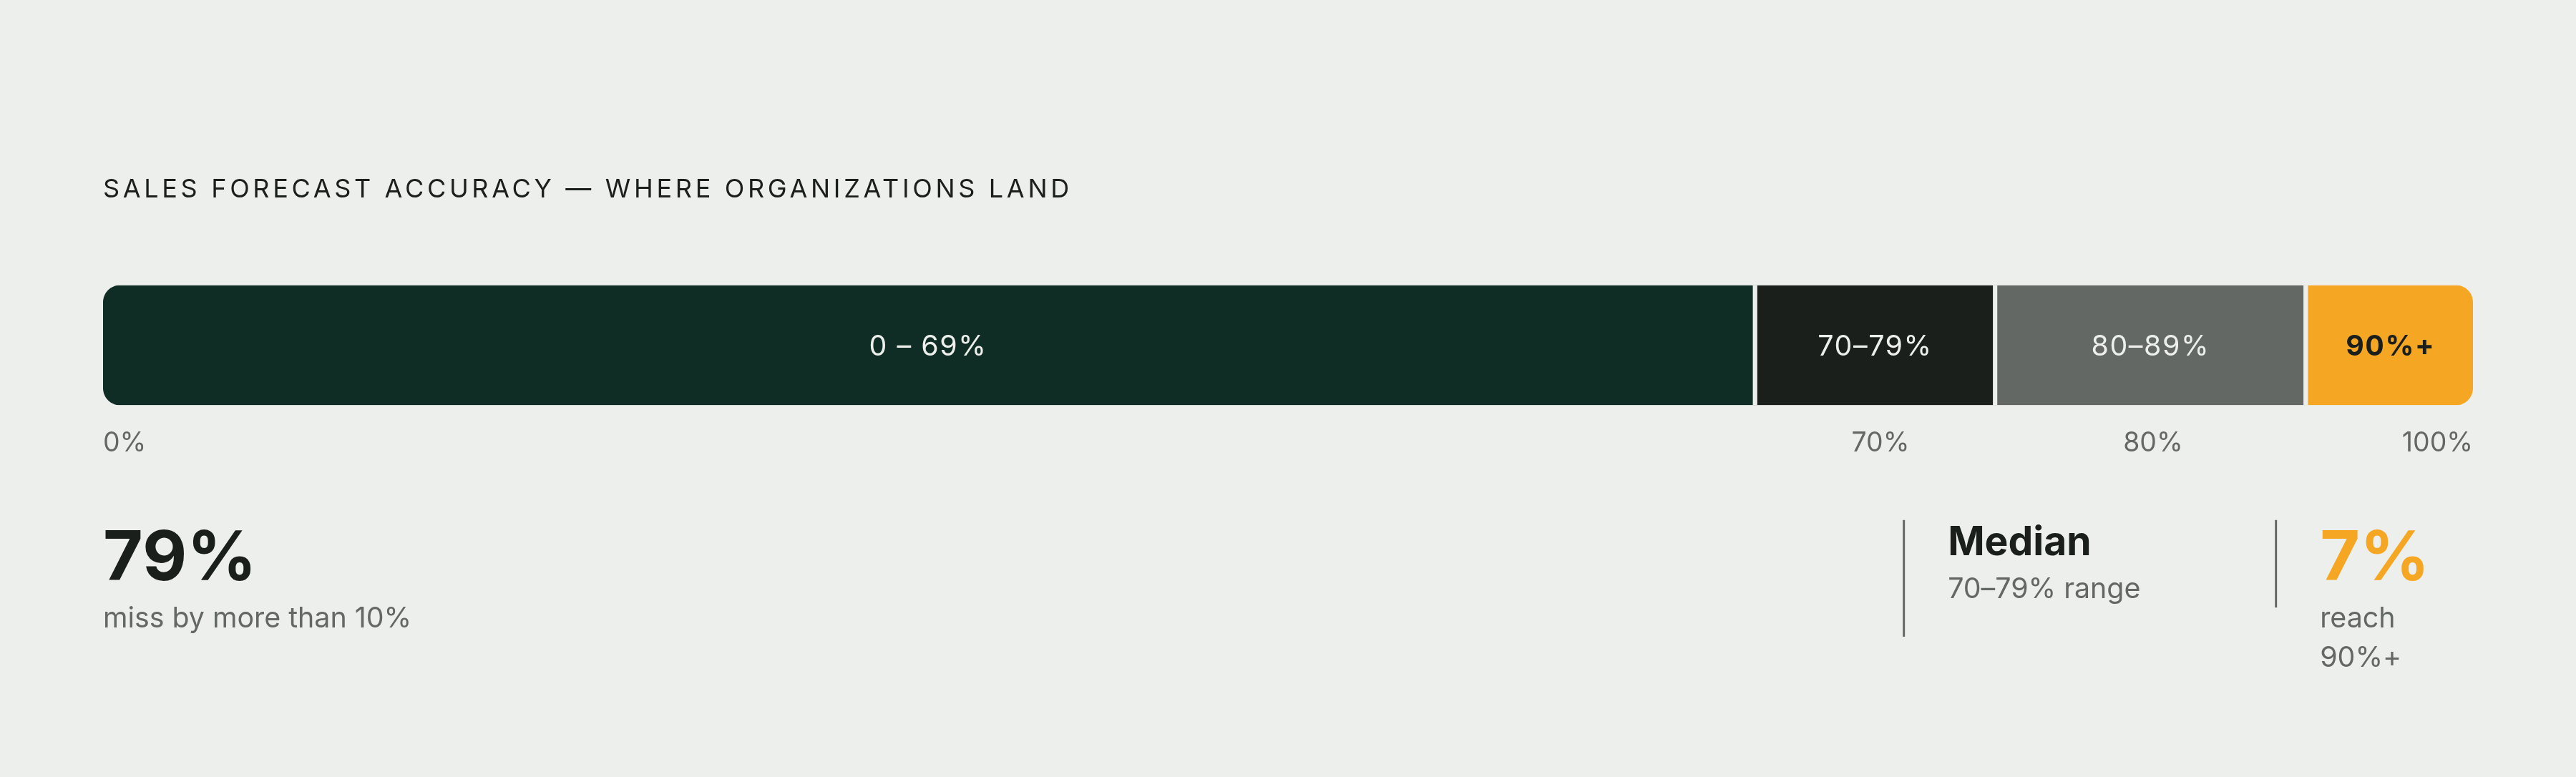
Sales forecasts miss constantly, and the miss almost always traces back to one thing: the wrong model, fed the wrong data. Only 7% of sales organizations hit 90% forecast accuracy or higher, with a median somewhere in the 70-79% range, according to Gartner. That's not a rounding error. That's most companies planning headcount, spend, and board commitments off numbers that are wrong by double digits.
The scale of this is bigger than a few bad quarters. Gartner found that 79% of sales organizations miss their forecasts by more than 10%. Clari Labs reported that 87% of enterprises missed revenue targets in 2025. Sales cycles are stretching (up 22% since 2022, per Optifai) and win rates are sliding (a median of 19%, per Ebsta and Pavilion), and 69% of sales operations leaders told Gartner that forecasting is getting harder, not simpler, as a result.
Faced with that mess, most teams do the same thing: they grab the forecasting method that's easiest to set up, or the one everyone else seems to use. That instinct is exactly backwards. Different forecasting models aren't interchangeable tools that all do roughly the same job. Each one is built for a specific mix of data maturity, deal length, and business stage. Pick the wrong one, and you get a number that looks precise and means nothing. The rest of this piece is a map: what each model does, what it needs from you, and how to tell which one actually fits your business.
How data quality shapes which models are even available to you
What does your CRM data even allow you to build?
A Validity survey found that 76% of CRM users say less than half of their CRM data is accurate and complete. More strikingly, 37% said bad data cost them actual revenue, not hypothetical revenue. That's not a hygiene problem sitting off to the side. It's the ceiling on which models will work for you at all.
A fancy regression model built on messy CRM data will often produce a worse forecast than a plain historical average built on clean data. Complexity doesn't rescue bad inputs. It amplifies them. Gartner has found that improving CRM data hygiene alone can lift forecast accuracy by up to 30%. And it's not just about fixing records once. Research from Digital Bloom found that teams tracking pipeline velocity irregularly achieve just 52% forecast accuracy, while those checking in regularly perform substantially better. How often you look at the data matters almost as much as what model you run on it.
So before touching a single formula, it helps to place your team on a simple data-maturity scale:
Low maturity: less than 12 months of clean CRM history, stages tracked inconsistently, updates entered by hand
Keep that scale in mind. Every model below has a data requirement, and that requirement maps directly onto these three tiers. Tools that automate CRM logging, like Nextstep, which captures call activity, drafts updates, and logs next steps directly into CRM platforms, tackle this at the root: they remove the manual rep-entry step that degrades most CRM datasets in the first place. A model can only be as accurate as the data a rep bothered to type in, and reps, understandably, don't always bother.
The four categories every sales forecasting model belongs to
Two words get used interchangeably in this space that shouldn't be: method and model. A method is the broad approach. A model is the specific technique inside that approach. One method can hold several models, and a single model can borrow from more than one method. This explains why companies often run more than one at once.
Broadly, every forecasting approach falls into one of four buckets:
Time series / projection: uses historical patterns, trend, seasonality, cycle, and projects them forward. Assumes tomorrow looks like yesterday. Causal / quantitative: studies the relationship between sales results and outside variables, like marketing spend or economic conditions. More work to build, more precise when the data backs it up. Qualitative: built on expert judgment, rep experience, and market read. Fast to set up, needs almost no historical data, but swings wildly in accuracy. AI / ML-powered: pulls signals from many sources at once to score deals probabilistically. Highest ceiling for accuracy, highest bar for data and tooling.
Most companies don't pick just one. A common setup: historical trend as the baseline, weighted pipeline as the day-to-day operational forecast, and a model-scored layer on top to flag risk. Think of these four categories as the map. The sections ahead are the terrain.
Intuitive and rep-submitted forecasting: where most teams start and why it stalls
This is the oldest model in the book: each rep looks at their pipeline and says what they think will close. No formula, just judgment.
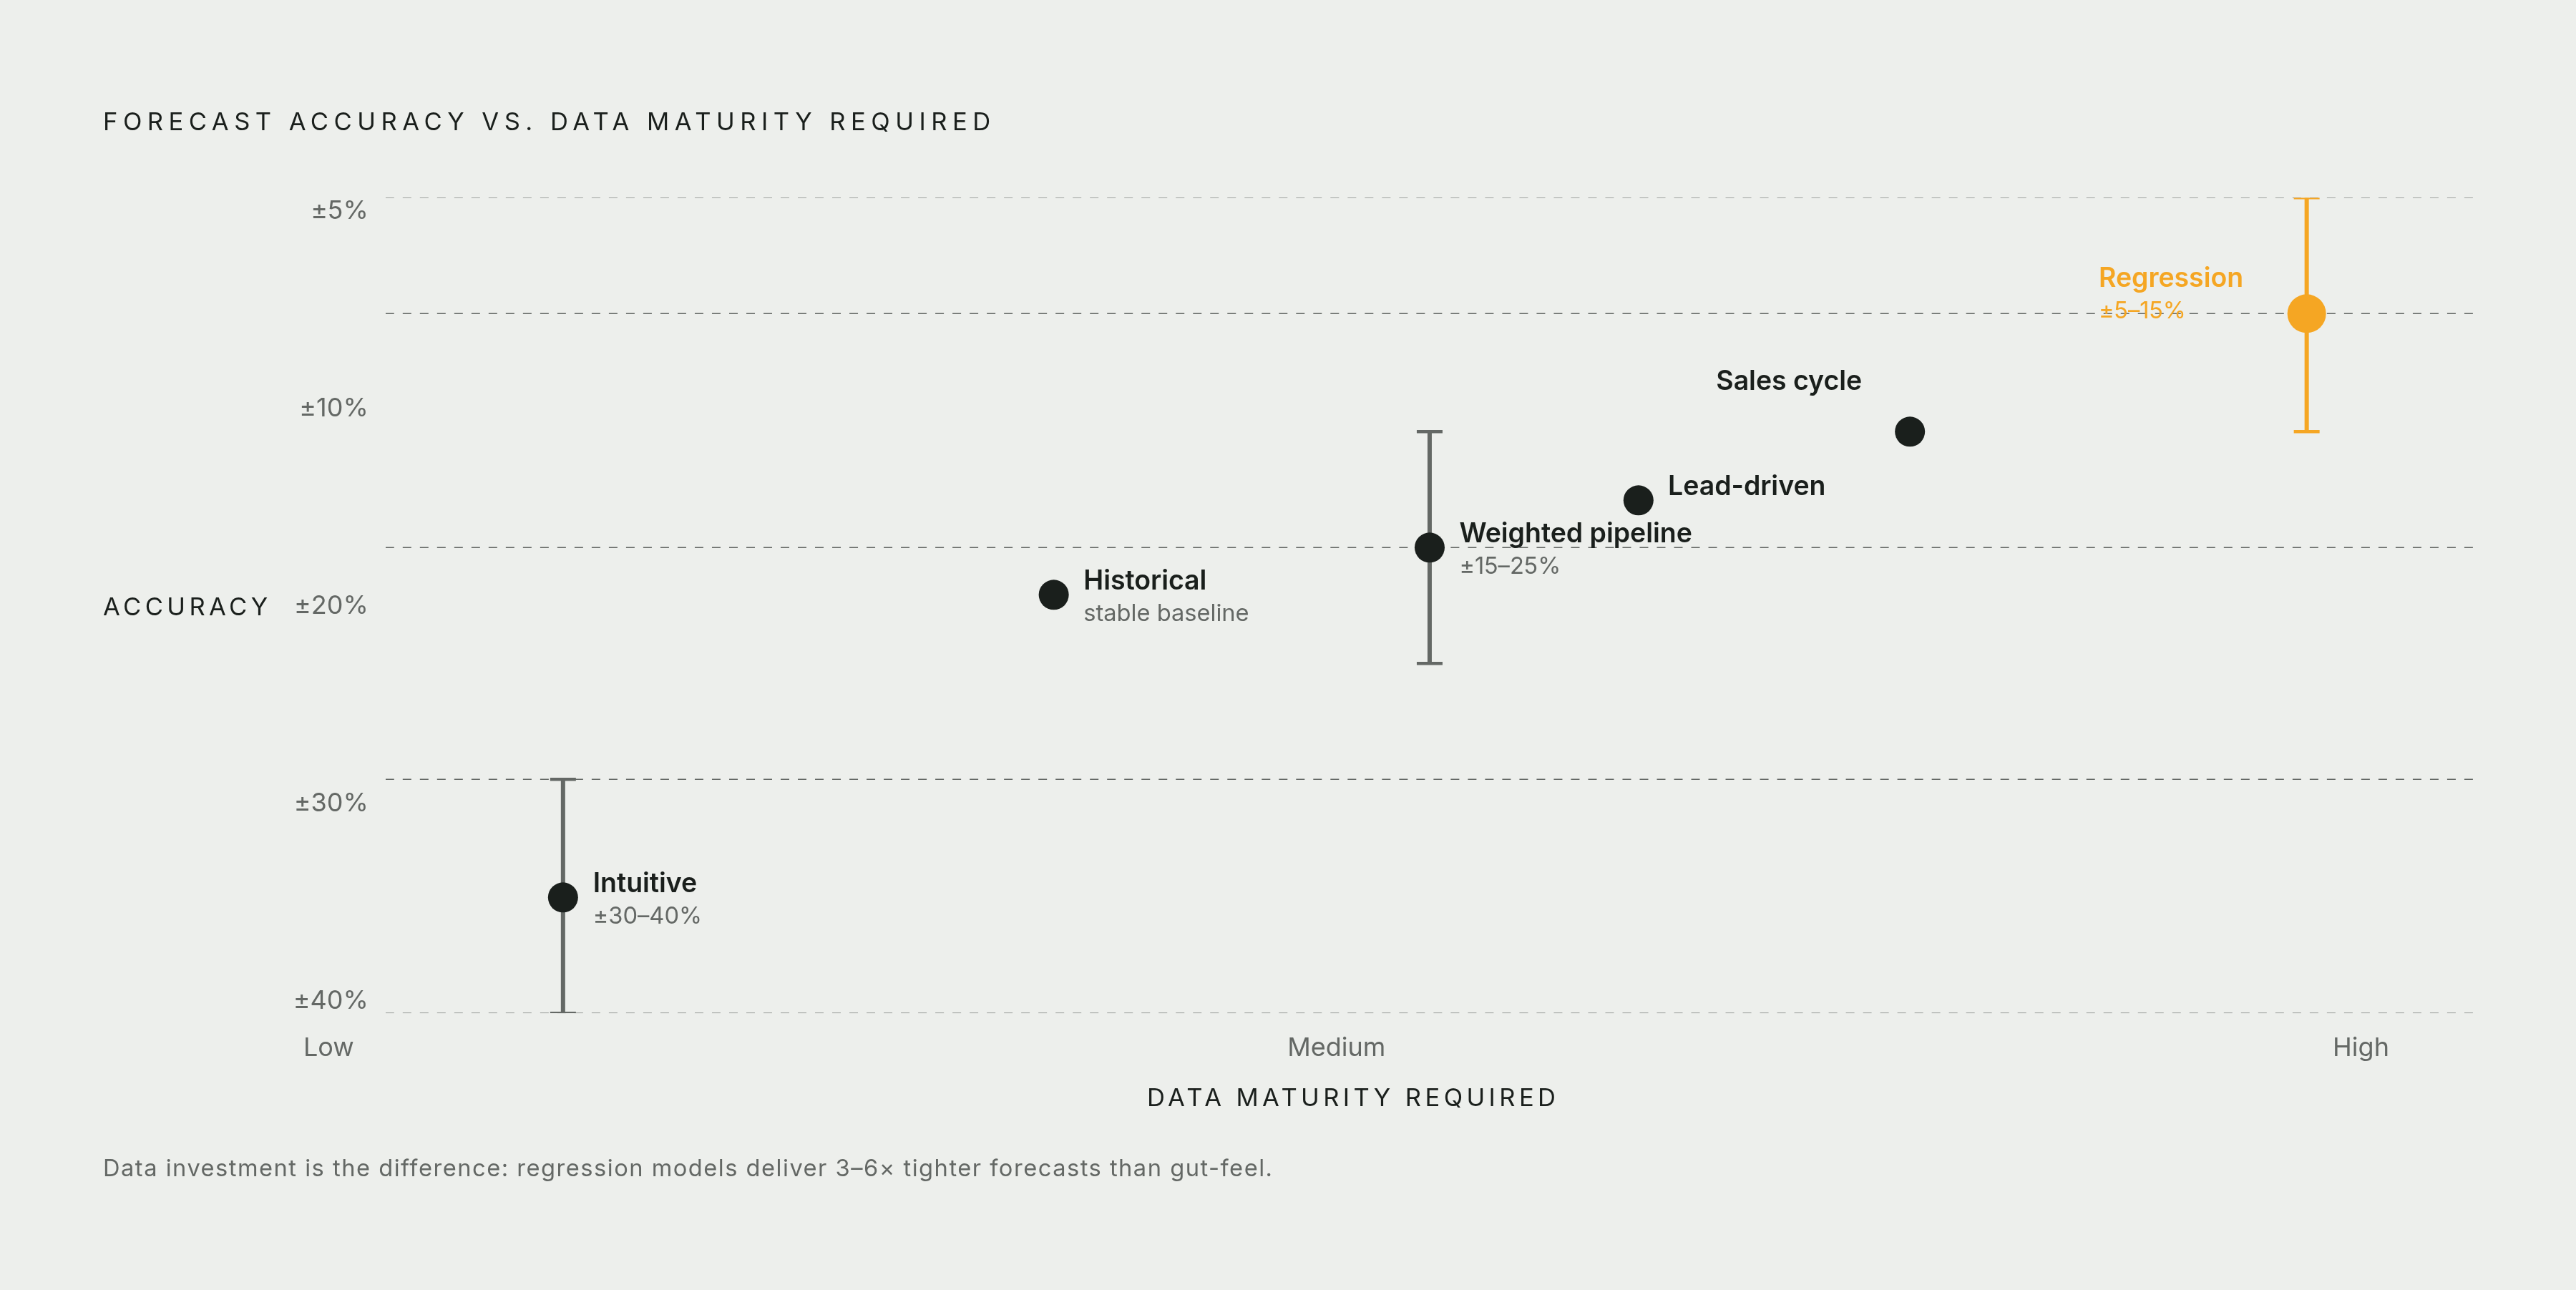
The accuracy band on this runs wide, typically off by 30-40% from actual results. That's a big miss. But it's not a useless model, and dismissing it entirely misses something real: reps pick up on things no dataset captures. A champion just got promoted. The CFO went quiet on the last call. A competitor is undercutting on price this week. That kind of intelligence isn't captured by a CRM field, because reps pick up on things no dataset records.
The flaw is that rep commit numbers are shaped by things that have nothing to do with the deal. It's that rep commit numbers are shaped by things that have nothing to do with the deal: optimism, quota pressure, a natural reluctance to call your own deal dead. Left unchecked against historical data or pipeline behavior, commit forecasts drift upward and quietly hide the late-stage risk sitting in the pipeline.
So when does gut-feel forecasting actually earn its keep?
- Entering a brand-new market or launching a product with zero historical baseline
- A genuinely experienced team with deep, verifiable read on their market
- Used as one input layered onto a quantitative model, not standing in as the whole forecast
Once a team has a full 12 months of clean CRM data, sticking with gut feel alone is no longer a shortcut but a choice with a measurable cost attached.
Historical and trend-based forecasting: the right baseline for stable businesses
Take average revenue over the last 3, 6, or 12 months. Apply the growth rate you've observed. Project forward. That's the whole method.
Workday frames the formula simply: Forecasted Sales = Current Sales × (1 + Growth Rate). So $500,000 in monthly revenue growing at 5% a month projects to $525,000 next month. No mystery, no black box.
This works well when the business is steady: consistent demand, stable sales cycles, deal sizes that don't swing much month to month. It's a natural fit for SaaS renewal forecasting, where churn and expansion tend to move in predictable bands.
It assumes buyer demand and close rates aren't affected by anything happening outside the historical window. That assumption holds fine in a calm market. It falls apart the moment something changes, a new competitor, a pricing shift, a product overhaul. Treat this model as a benchmark.
Data requirement: at least one full, clean historical cycle, usually 12 months. If CRM data before that point is a mess, this shouldn't be your main model yet. For early-stage teams, this often is the whole forecast. For more mature teams, it becomes something else: the sanity check the pipeline forecast has to explain itself against.
Opportunity stage and weighted pipeline forecasting: the industry default and its hidden ceiling
This is the one nearly everyone uses, because it's visual, easy to explain, and built into every CRM out of the box. Assign each pipeline stage a close-probability based on historical conversion, multiply deal value by that probability, and add it up. A $10,000 deal at a 45% "demo" stage counts as $4,500 toward the forecast.
When CRM hygiene is solid, accuracy is in the ±15-25% range. When hygiene is inconsistent, accuracy drops to just 60-75%, according to Clari benchmarking. The model isn't broken. The data feeding it usually is.
There's a structural gap here too, separate from data quality: stage probability has no concept of time. A deal that's been sitting in "Proposal" for four months gets the exact same weight as one that arrived last week. Stalled deals are one of the most common, and most invisible, sources of forecast inflation. The pipeline looks healthy right up until it doesn't close.
For SMBs already living in HubSpot, the native weighted pipeline is the path of least resistance, and clean data there captures most of the accuracy this model can offer, without the price tag of an enterprise AI tool. It earns its place as the primary model when:
- The business is small-to-midsize with short, consistent sales cycles
If deals keep stalling without moving stages, that's the signal to add sales cycle length forecasting on top, since stage weighting alone won't catch it.
Sales cycle length forecasting: the timing model for complex B2B deals
Weighted pipeline answers "will this close." It says nothing about "when." That's the gap this model fills: calculate the average time from first contact to close across historical deals, then apply that duration to what's currently open.
It can be broken down further, by deal type: referrals close differently than inbound leads, which close differently than deals sourced from a field event. Segmenting by type sharpens the forecast, but it only works if reps are logging how and when a prospect actually entered the pipeline, another place where manual data entry quietly wrecks the model.
The real value here is early warning. If average cycle length is creeping up across the board, that's a signal to adjust year-end targets now, not in December when the math finally catches up. This model catches revenue gaps months before they show up as a crisis.
It works best when cycle length itself is stable, not whipsawed by a major go-to-market shift or outside disruption. After a big strategy change, the historical averages stop meaning much until new data accumulates. Data requirement sits medium-to-high: consistent entry-date tracking and deal-type tagging, done consistently, not sporadically. Best fit: B2B teams running multi-stage, complex deals where timing, not just probability, is the thing keeping planning up at night (headcount, capacity, cash on hand).
Lead-driven forecasting: connecting marketing pipeline to revenue projections
This model starts upstream, with lead volume, and multiplies it by historical conversion rates at each stage to project revenue. It ties the sales number directly to what marketing and sales are actually doing.
It works best for companies with predictable lead sources, conversion rates that have been tracked long enough to trust, and sales cycles that don't vary wildly deal to deal. High lead-volume businesses running consistent campaigns get the most out of it.
One underrated benefit: it turns the forecast into shared territory between marketing and sales. When the number misses, the model tells you why. Was it a volume problem (fewer leads came in than planned) or a conversion problem (leads came in but didn't close at the usual rate)? That's a much more useful conversation than everyone pointing fingers.
Where it breaks: lead quality shifts, a new channel, a different ideal customer profile, new messaging, without anyone updating the conversion assumptions that feed the model. When that happens, the forecast keeps producing a confident-looking number that's quietly wrong. Data requirement is medium: reliable lead-source tagging, conversion tracked stage by stage, and enough volume for those conversion rates to mean something statistically. On its own, it's rarely the whole enterprise forecast. It shines either as one piece of a larger stack or as the main model for high-volume, transactional sales motions.
Top-down forecasting: when to start from market size and work backward
Flip the direction entirely: start with total addressable accounts, multiply by expected penetration rate, then by average deal size, then by expected close rate. Work backward from the size of the market to a revenue number.
This is intentionally rough, intentionally rough at the annual level. It's built for framing a conversation, not running day-to-day operations. It earns its place when:
- Launching a new product or entering a market where there's no bottom-up pipeline to draw from yet
- Building the story for investors or setting targets at the board level
- Reality-checking a bottom-up forecast: does the team actually have the capacity and market access to hit this number?
Forecastio documents what happens when top-down forecasting gets used for more than framing: a finance team leaned entirely on top-down projections and hired and spent accordingly. The projections never accounted for something the bottom-up pipeline data was already showing: sales cycles were stretching out. Actual revenue landed 28% below the projection. The result was a cash flow shortage, emergency cost cuts, and a product roadmap pushed back six months.
The lesson is that top-down is a target, not a forecast. It's that top-down is a target, not a forecast. The moment it replaces bottom-up pipeline visibility instead of sitting alongside it, the gap between plan and reality goes dark, and stays dark, until the numbers come in and it's too late to do anything but react.
Regression and multivariate forecasting: the models that find what the pipeline misses
These two get covered together because they sit at the same data tier and the same accuracy tier, even though they work differently.
Regression analysis (single or multivariable) studies the statistical relationship between sales results and outside variables, marketing spend, pricing moves, broader economic conditions. A clean example: modeling how ad spend and pricing changes move monthly revenue, to project what a marketing investment will actually return.
Multivariate, multi-signal forecasting goes deeper into the deal itself, pulling in behavioral variables like how many stakeholders are involved, whether the budget-holder actually showed up to meetings, whether the pricing deck got opened, what intent signals are showing up online. This finds patterns a stage-based model simply can't see. RevPartners' 2026 research found that VP-level involvement by the second meeting correlated with an 80% close rate; without that VP in the room, the same deal profile dropped to a 20% close rate. Stage alone would never have surfaced that gap.
Together, these models, combining historical data, pipeline behavior, and deal-level signal, hit ±5-15% variance. That's the payoff for the higher data bar.
Part of what's making this possible now is what RevPartners calls the "dark funnel," the layer of buyer intent that happens before anyone fills out a form: a prospect researching your category, comparing pricing, reading reviews, all without ever touching your CRM directly. Tools built to surface that activity are giving multivariate models signal that simply didn't exist for most sales teams a few years ago. None of it works without the underlying data being clean, consistent, and actually captured in the first place. The model was never really the bottleneck. The data feeding it always was.