How to Measure Whether Your Sales Enablement Platform Is Working
Track usage metrics separately from the behavioral changes that actually drive revenue.

The dashboard looks healthy. Logins are up, training completions are climbing, certification progress bars are filling in green across the team. By every number on the screen, the enablement platform is doing its job. None of those numbers answer the only question that actually matters: is anyone selling better because of it?
Logins, training completions, content views, and certification progress tell you whether people are opening the platform, and that gap between activity and impact is what sits beneath most sales enablement reporting. They say nothing about whether opening it changed how a rep handles a discovery call, how fast a deal moves through the pipeline, or whether the company closes more business this quarter than last. Activity and impact are different questions, and most teams only have an answer for the first one.
The reason this happens isn't a mystery, and it isn't really about data quality. Enablement teams get funded, hire content people, and build out large libraries of decks, battlecards, and training modules. Then, when it comes time to report on all that investment, they report on usage telemetry, because usage telemetry is easy to pull and revenue attribution is hard to defend. Counting logins is simple. Proving that a specific training module shortened a specific sales cycle takes real analytical work, and most teams never get asked to do that work until the budget is already at risk.
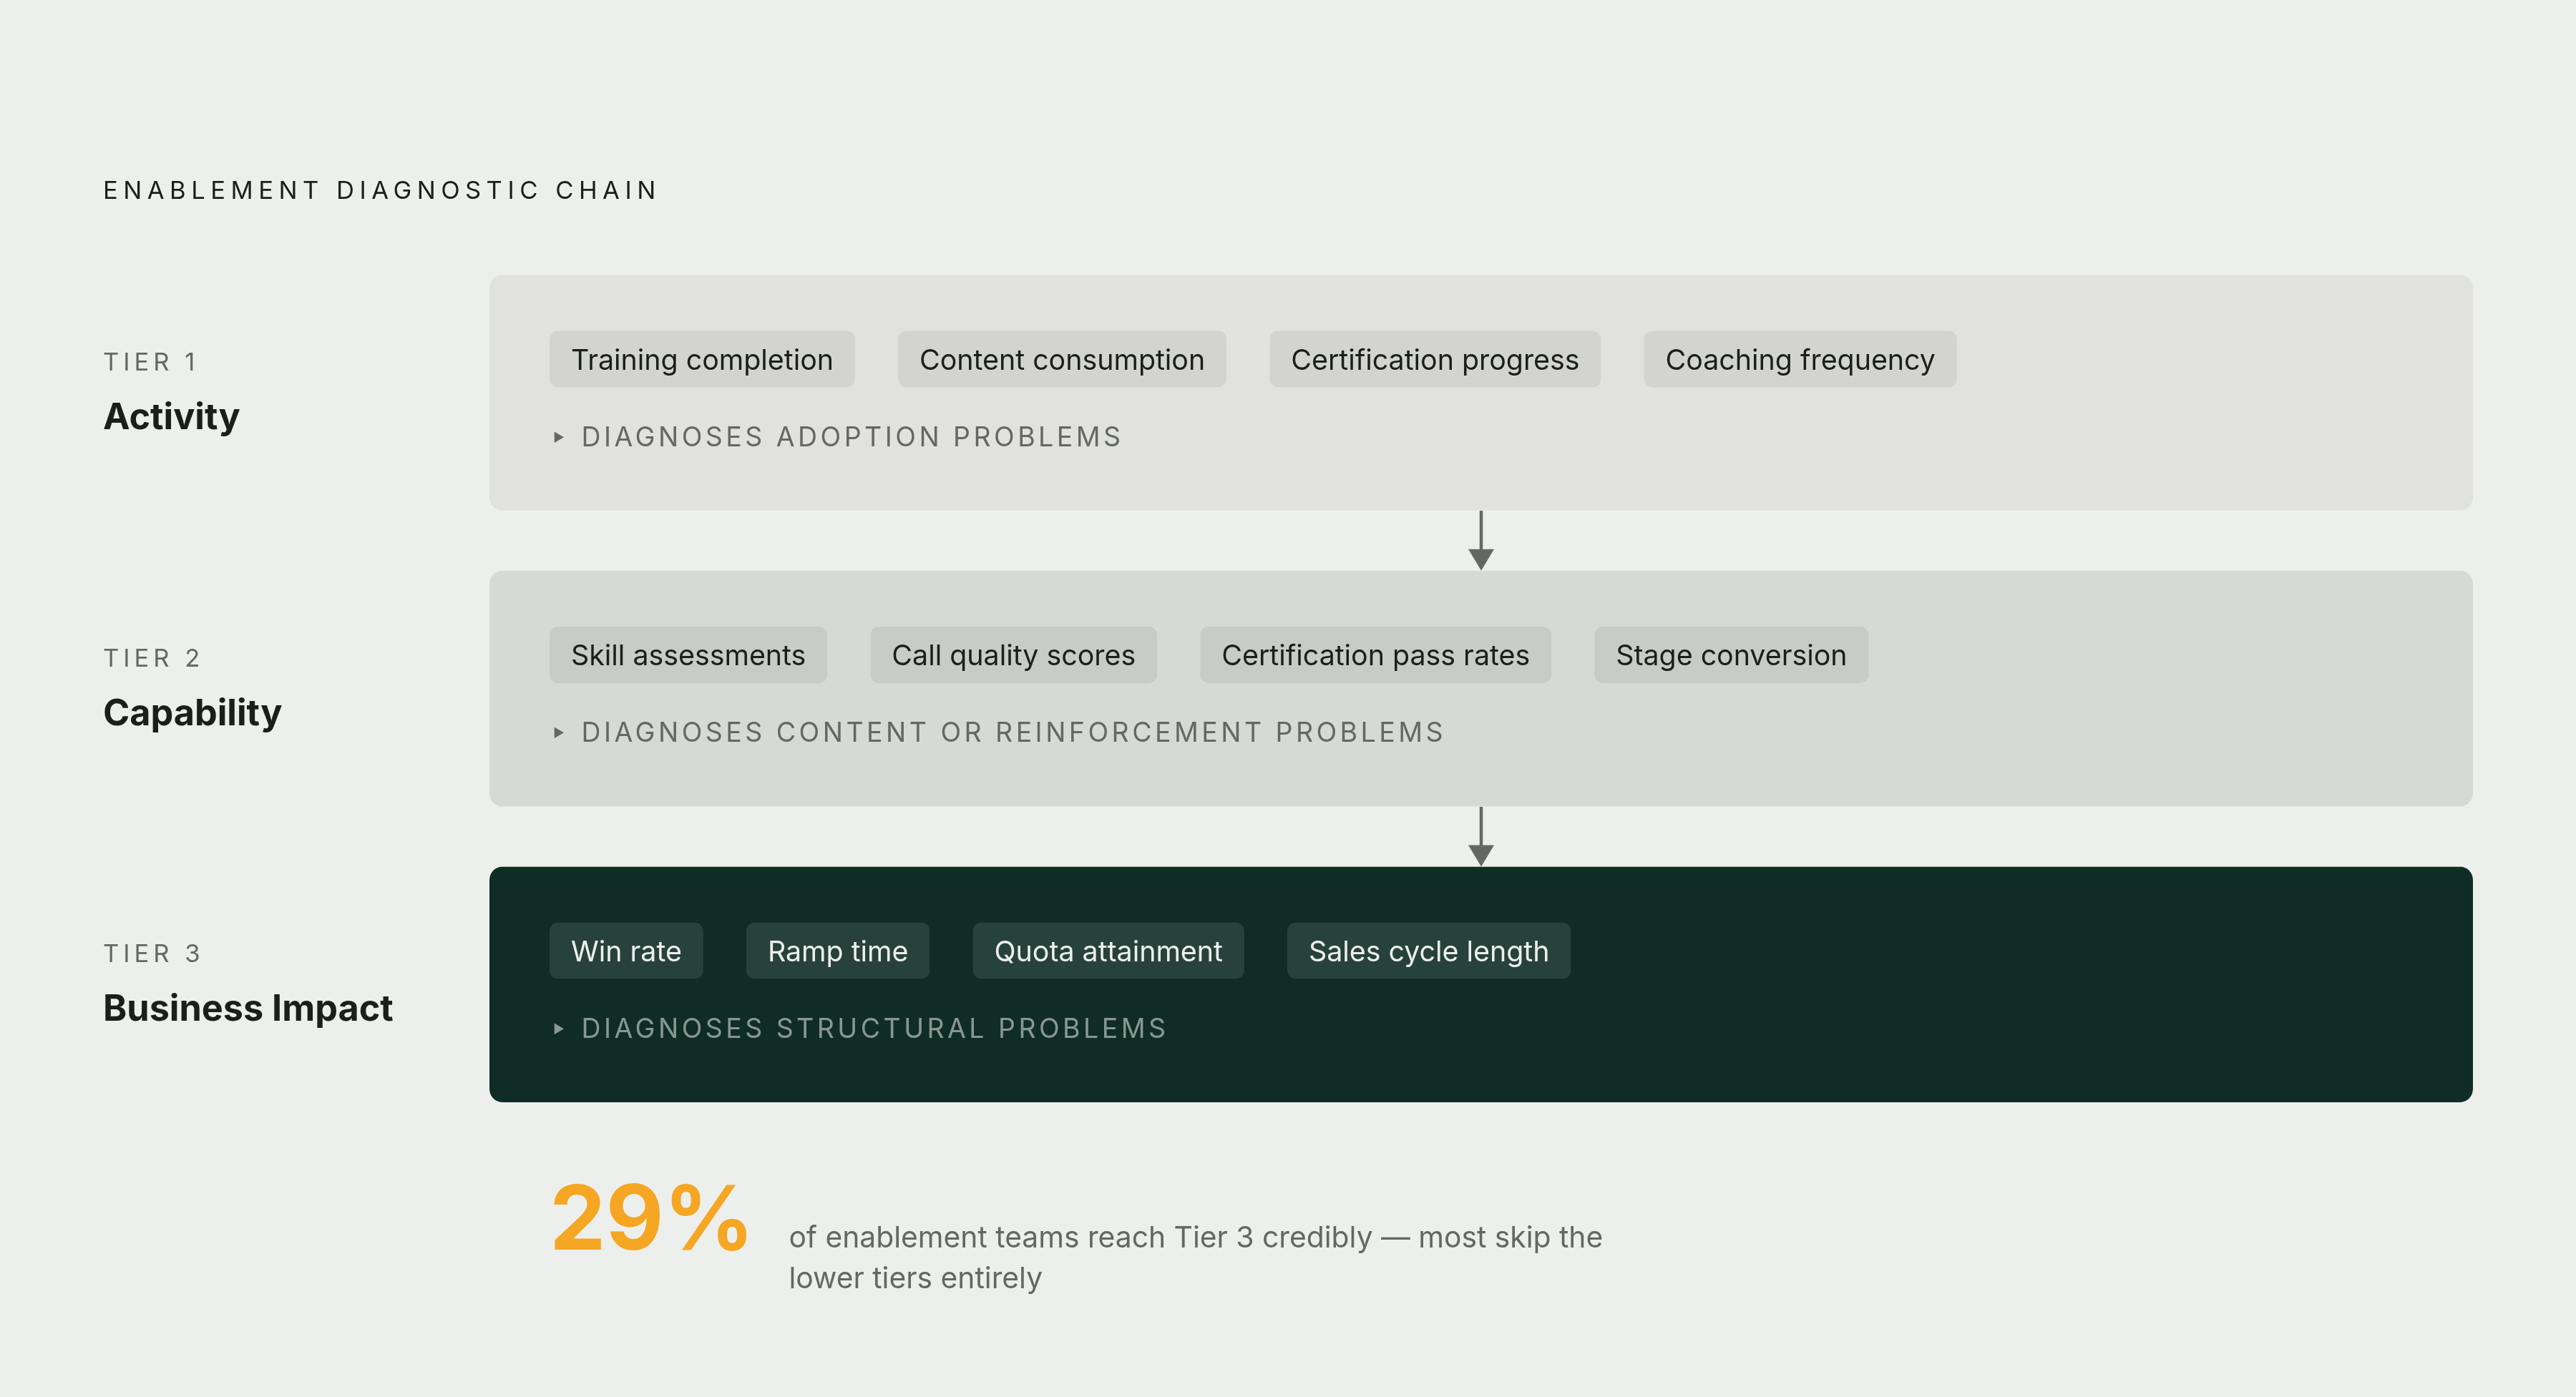
That's exactly the trap. Only 29% of enablement teams can directly tie their programs to revenue impact. The remaining majority are, in effect, one difficult budget conversation away from losing funding, because the moment a CFO asks what enablement actually produced, activity metrics have no good answer. Gartner has flagged the same pattern from a different angle: enablement teams tend to track objectives they can't directly control, like top-line revenue, while under-measuring the things they actually do control, like seller skill development, behavioral change, and speed to productivity. Teams are grading themselves on the wrong exam, and then acting surprised when the score doesn't hold up under scrutiny.
What a three-tier measurement framework measures
Fixing this starts with separating three questions that enablement teams tend to blur together: are people engaging with the platform, are they actually getting better at selling, and is that improvement making the company more money? Each question needs its own tier, its own metrics, and its own timeframe, because trying to answer all three with one dashboard is how activity metrics end up standing in for proof of impact.
Everything in this framework points toward a single formula, the number a CFO wants: (Revenue Attributed to Enablement minus Enablement Investment) divided by Enablement Investment, multiplied by 100 [1][2]. But arriving at a defensible version of that number isn't something a team can shortcut by jumping straight to revenue data. It has to be earned by working through all three tiers in order.
Tier 1 covers activity metrics: training completion rates, content consumption, certification progress, coaching session frequency. These are leading indicators, and they're the easiest numbers in the entire system to produce. Tier 2 covers capability metrics: skill assessments, call quality scores, certification pass rates, stage conversion and velocity. These measure whether training is actually changing behavior. Tier 3 covers business impact: new hire ramp time, win rate, average deal size, sales cycle length, quota attainment, revenue per rep, customer retention and expansion. These are the numbers the CFO and CEO care about, and they only become credible once Tiers 1 and 2 have established that enablement is actually the thing driving the change.
The order affects which failure a team can diagnose: skipping it leaves them unable to tell adoption problems, retention problems, and structural problems apart. Treat the tiers as a diagnostic chain. Low Tier 1 numbers point to an adoption problem, plain and simple: if reps aren't using the platform, nothing downstream can be credited to it. Strong Tier 1 paired with weak Tier 2 points to a content or reinforcement problem, people are completing training but not retaining or applying it. Strong Tiers 1 and 2 paired with flat Tier 3 results points to something structural, maybe a market condition, a pricing issue, or an attribution gap that needs closer examination. Each pattern diagnoses a different failure and calls for a different fix. Skipping straight to Tier 3 metrics without checking the first two tiers leaves a team with no way of knowing which of those three problems it's actually looking at.
Tier 1 in practice: what healthy adoption looks like
Tier 1 data earns its place in the framework as a floor check. Its value is diagnostic rather than evaluative: it tells a team whether the platform has a chance of working, not whether it's working.
Healthy Tier 1 data has a specific shape. Completion rates trend upward across cohorts rather than flatlining after the first group goes through training. Content consumption tracks with deal stage, meaning reps pull up the competitive battlecard when they're actually in a competitive deal, rather than every asset getting consumed once during onboarding and never again. Coaching session frequency stays consistent across the whole team instead of concentrating among the reps who were already hitting quota.
This tier is for spotting the opposite pattern early. A significant share of sales leaders log into their enablement platforms fewer than five times per quarter. A platform reps rarely open can't be credited with any downstream result, no matter how good the content inside it is. Content adoption shows a similar failure from a different angle: 65% of marketing content goes unused by sales teams, a figure that has held for over a decade. Usage telemetry usually tells the same story every time, a small fraction of assets account for nearly all the activity, while reps keep sending the same deck they saved to their desktop two years ago.
It's a findability and relevance problem, and Tier 1 data can surface it before it turns into a Tier 3 revenue problem. Catching it here, in the activity data, costs a lot less than catching it later in a quarter with a soft win rate and no clear explanation why.
What Tier 1 can't tell a team is whether any of this activity actually worked. Completions don't prove competency. Content views don't prove the content influenced a deal outcome. Coaching session counts don't prove anyone's behavior changed. All of those questions belong to Tier 2. One useful gut check at this stage: high-performing sales teams are more likely to measure enablement's impact on the wider organization. A team reporting only Tier 1 numbers up to senior leadership is showing a form of misalignment that functions as a warning sign on its own.
Tier 2 in practice: the capability signals that predict revenue before revenue moves
Tier 2 is where enablement earns the right to talk about revenue, before revenue actually shows up. Capability metrics matter because they're the earliest real evidence that training produced durable behavior change rather than a short-lived bump in engagement, and they give enablement teams something concrete to show leadership before a full sales cycle has even closed.
A few measurements do most of the work here. Pre- and post-training skill assessments, run at regular intervals, show whether knowledge is being retained rather than just acquired once and forgotten. Call quality scores pulled from conversation intelligence tools add detail: discount mention frequency, question count, talk-to-listen ratio, and how well a rep handles a competitor objection all give an objective read on whether the behaviors covered in training are actually showing up on live calls. Pitch certification pass rates add a structural gate, separating "completed the training" from "can actually demonstrate the skill." And stage conversion rates paired with stage velocity, deals moving through the pipeline faster after a training rollout, give a leading signal that appears well before quota attainment numbers do.
One data point makes the strongest case that measurement itself, not just training, drives outcomes. Supered's 2026 analysis found that the most-inspected sales teams hit quota at a far higher rate than the least-inspected teams. The act of inspecting and measuring capability signals changes what happens on the ground, not just the reporting about it.
Generating this kind of data at scale used to depend entirely on manager time, and manager-led coaching reaches reps unevenly, since some managers coach every week and others rarely coach. AI-assisted coaching is changing that: teams using AI-powered coaching are more likely to report higher win rates, because the coaching reaches every rep on the team rather than just the ones whose manager happens to prioritize it. Tools that sit in the call, log what was said, draft follow-up summaries, and surface deal context automatically, including AI revenue operations platforms like Nextstep, make this kind of Tier 2 measurement realistic at volume. They produce structured call behavior data without asking reps to manually log their own observations after every call, which is the step that usually causes this kind of tracking to fall apart.
Content effectiveness belongs in this tier too, once it moves past simple view counts. Correlating specific assets to deal outcomes, tracking which pieces of content show up in deals that close versus deals that stall, turns content analytics from a Tier 1 vanity metric into a genuine Tier 2 signal about what's actually influencing buyers.
Tier 3 in practice: the four business impact metrics worth anchoring an argument on
Not every Tier 3 metric deserves equal space in a budget conversation. Four stand out because they come with the clearest causal story, the cleanest before-and-after structure, and the strongest published benchmarks behind them, which makes them defensible in front of a CFO rather than merely suggestive.
Win rate carries the clearest signal of the four. CSO Insights found that organizations with sales enablement achieve a notably higher win rate on forecasted deals than those without. The Ebsta/Pavilion 2025 GTM Benchmarks, drawn from a large pipeline sample across thousands of CROs and sales leaders, found that organizations with aligned sales enablement functions achieved substantially higher win rates and shorter sales cycles. Making this comparison work requires a real baseline and a consistent definition of what counts as a "forecasted deal." Without both, the number floats free of anything comparable.
New hire ramp time makes the cleanest onboarding proof point of the four, because it can be calculated without wading into a deep attribution debate. Measure the days from a new rep's start date to their first closed deal, as well as the days to reaching a defined productivity threshold. The Bridge Group puts the median ramp time for B2B SaaS account executives at 5.3 months. Shaving even a few weeks off that number produces a revenue impact that can be calculated directly from quota and headcount, no modeling required.
Quota attainment does something different from the other three: it points at the sales process itself rather than at individual reps. When attainment is low across a team, the fix is usually a look at where the process breaks down, which gives enablement leaders a specific and fixable lever to pull instead of a vague mandate to "improve performance.
Sales cycle length is the Tier 3 metric most sensitive to the Tier 2 work on call quality and content relevance, and it's also the easiest of the four for executives to translate into a revenue-per-quarter impact. StarCompliance achieved a notable reduction in sales cycle length along with an increase in new logo win rates after improving qualification and engagement through SalesHood's platform.
One case shows all four working together. Allianz Trade built a dedicated enablement function backed by platform analytics and reported near-universal platform adoption, a meaningful jump in quota attainment, significant time saved per rep each week, and a 10% improvement in win rate. That result didn't come from any single tier. It came from activity, capability, and business impact metrics all pointing in the same direction at once.
The attribution problem
Attribution is the honest objection to this entire framework, and it deserves a straight answer rather than a dismissal. Revenue moves because of product quality, market conditions, pricing, marketing, rep quality, and sales management, all layered on top of each other at the same time. Isolating enablement's specific share of that is genuinely hard. Anyone claiming to have solved it completely is overselling the number.
The practical response is to apply a conservative discount to the measurement and say so openly despite attribution being messy. Conservative practitioners recommend discounting measured improvement by 25% to 50% before presenting an ROI figure, which produces a number built to survive scrutiny rather than one built to impress. A smaller number defended honestly holds up better in a budget review than a large number that invites a CFO to start picking it apart.
A few practical moves sharpen the attribution picture without pretending to fully solve it. Comparing a trained cohort against an untrained one, where some reps have been through a program and others haven't yet, produces a difference in outcomes that can be attributed to the program with far more confidence than a single team's before-and-after numbers. Running a before-and-after comparison over a long enough window for a full sales cycle to complete controls for seasonality and short-term market noise that a two-week snapshot would miss. Testing a single new training module or a single new content asset on a subset of deals before rolling it out company-wide produces a cleaner signal than changing everything at once and trying to sort out afterward what actually moved the needle.
None of this makes attribution easy, and it isn't supposed to; instead, it gives enablement teams a number they can stand behind in the room when the CFO asks what this actually produced. A team that has worked through all three tiers, discounted its own number, and can explain how it got there is no longer guessing, which is what separates a program that survives the next budget cycle from one that doesn't.
Sources
- Sales Enablement Statistics 2026: Market Size, ROI, Adoption, AI Trend
- How to Measure Sales Enablement ROI and Prove Training Impact: A Framework for Revenue Leaders - Sales Assembly
- How to Calculate Sales Enablement ROI: A Comprehensive Guide
- What Is a Sales Enablement Platform? The Complete Guide (2026) - Showpad