How Many Hours a Week Do Sales Reps Actually Spend on Admin
Sales reps waste nearly 29 hours weekly on admin instead of selling.

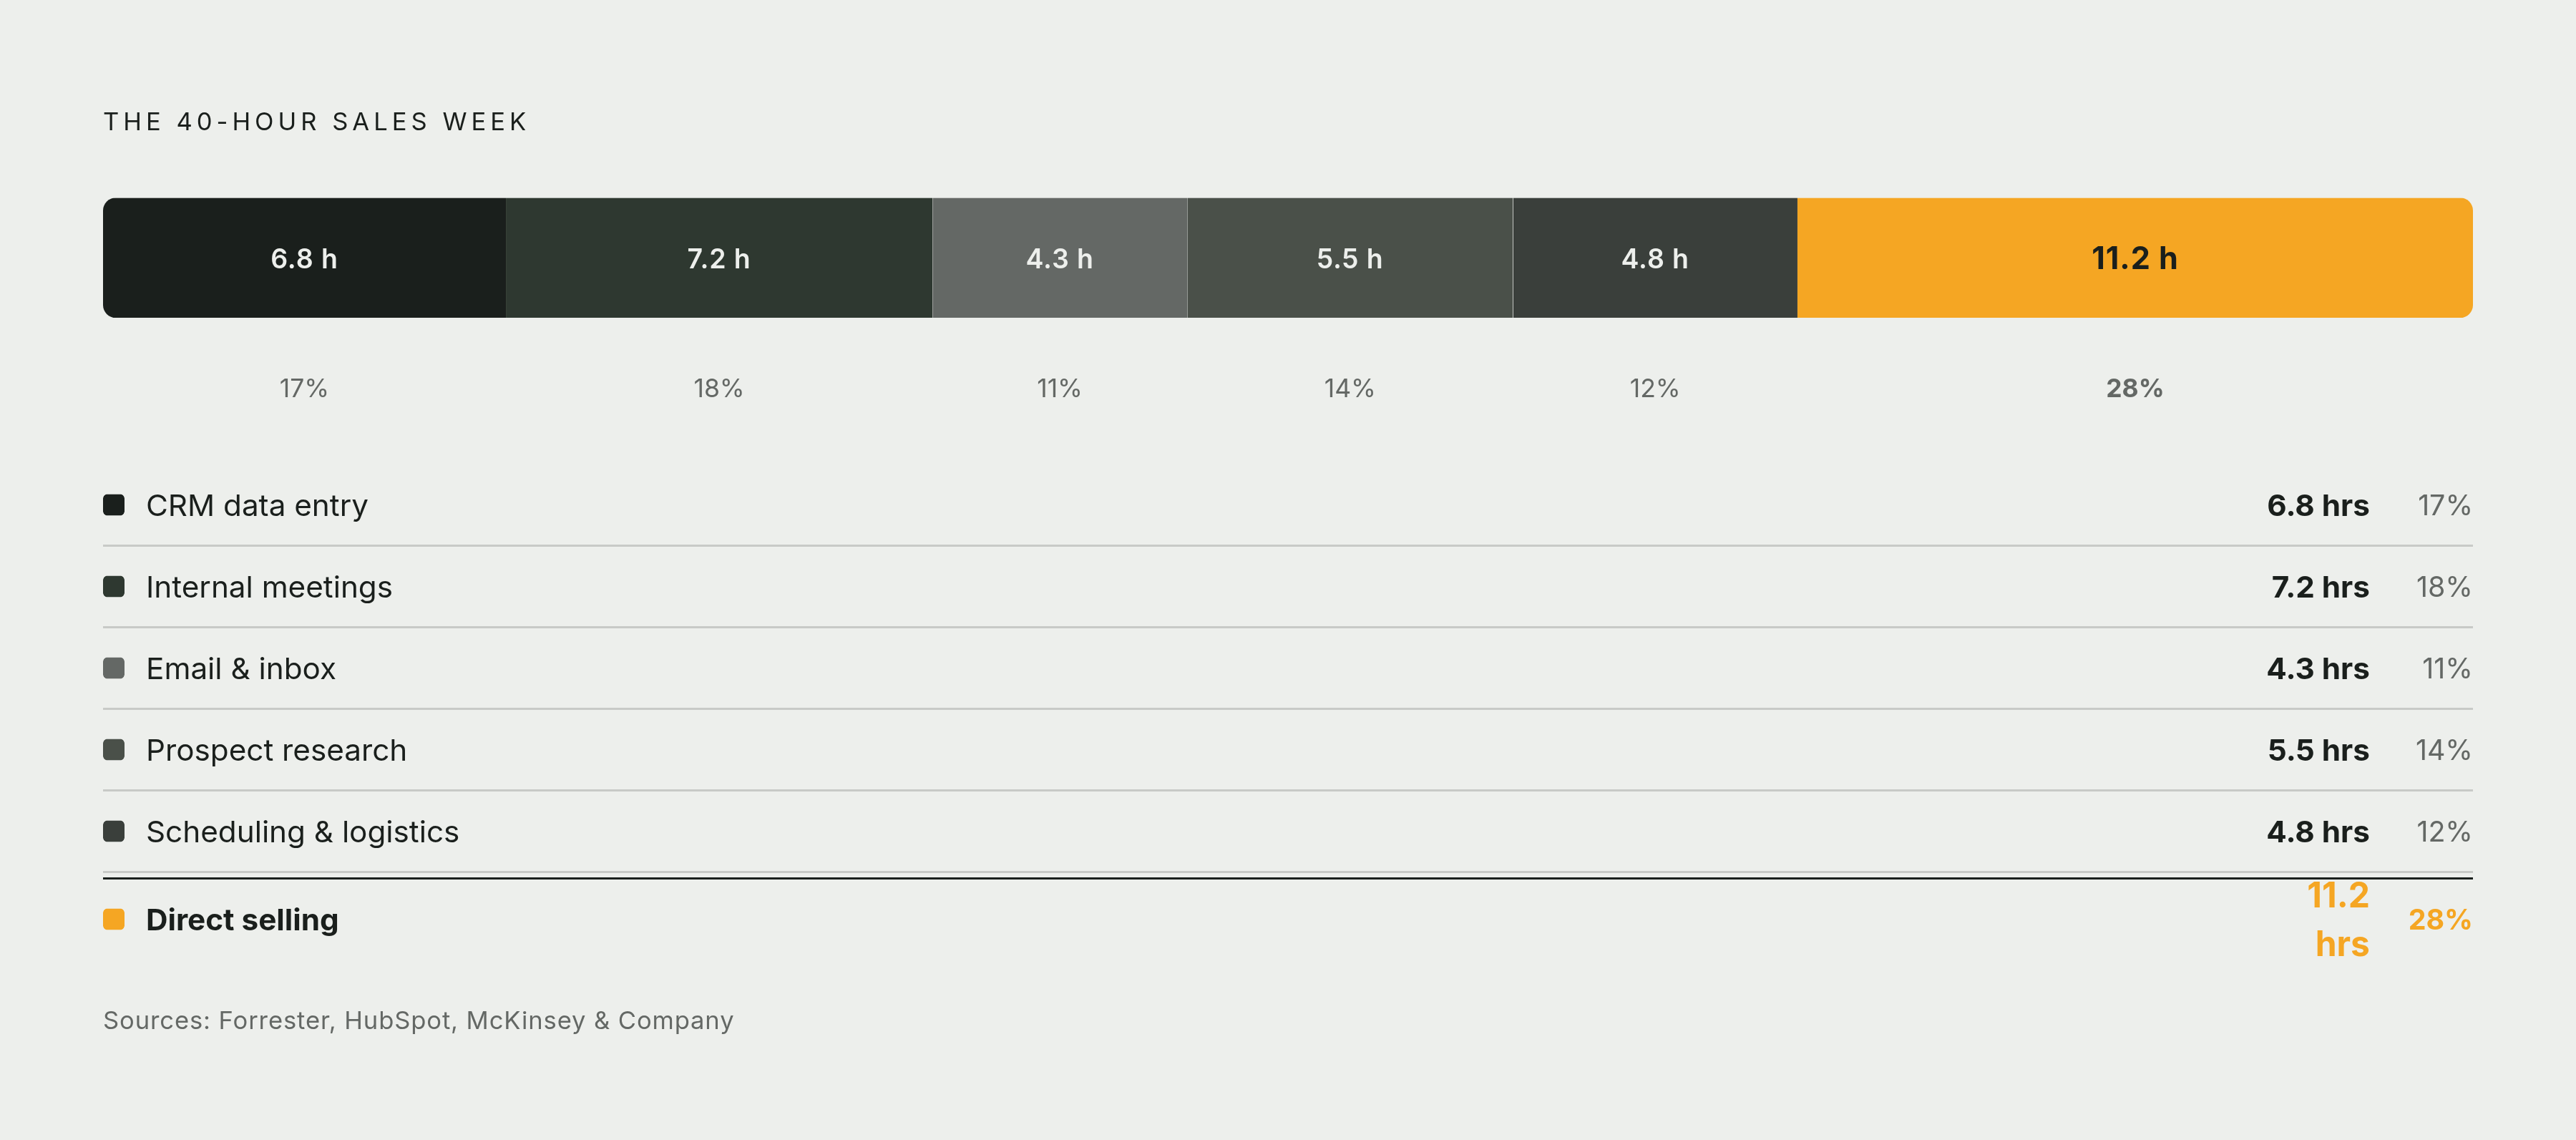
Sales reps spend most of their week doing everything except selling, and the numbers back that up in a way that should make any sales leader uncomfortable. Salesforce's State of Sales survey, which polled 5,500 sales professionals across 27 countries, found that reps spend just 29% of their workweek on direct selling activities Salesforce State of Sales (6th Ed.). Break that down into an actual 40-hour week and the picture gets sharper: about 11.2 hours go to selling, and the other 28.8 hours go somewhere else salesmotion.io. That 28.8-hour figure is really the whole subject of this article salesmotion.io.
What makes this more frustrating is how stuck the number has been. Despite years of new software, new dashboards, and new automation promises, Salesforce found only a two-percentage-point gain in selling time between 2022 and 2024. The 2026 State of Sales report puts selling time at 40%, which sounds like real progress, but that jump likely reflects early AI adopters pulling the average up, not a company-wide shift HubSpot Sales Trends Report Forrester. For most reps still working the old way, the 28-30% range from earlier years is a more honest description of daily life HubSpot Sales Trends Report Forrester. Field sales adds its own wrinkle. SPOTIO's 2026 State of Field Sales survey of 452 professionals found field reps spend only 38% of their time selling, meaning 62% gets swallowed by admin, broken processes, and putting out fires marketsandmarkets.com.
Field sales data shows low-turnover teams are more than twice as likely to run on one or two systems, while high-turnover teams are three times more likely to have five or more tools. This piece maps the leak, category by category salesmotion.io. One honest caveat before diving in: Bain & Company has found that self-reported time data is "inherently flawed," since reps tend to report what they intend to do rather than what actually happens. In one documented case, account managers reported spending a certain amount of time with customers, and when software actually tracked it, only a third of that reported time was real. Every figure in this piece should be read as directional, a strong signal of where time goes, not a courtroom-grade measurement.
Why the breakdown matters more than the headline number
Here's the thing about "28.8 non-selling hours": it sounds like one blob of wasted time, but it isn't (against a 40-hour week, that breaks down to 11.2 hours selling and 28.8 hours on everything else) salesmotion.io. It's at least six different categories, each with its own cause, its own owner, and its own level of fixability salesmotion.io. CRM entry is not the same problem as internal meetings. Email triage is not the same problem as scheduling. Salesforce's 2024 State of Sales survey of 5,500 professionals across 27 countries found reps spend only 29% of their workweek on direct selling activities Salesforce State of Sales (6th Ed.).
Not all non-selling time is wasted time. LinkedIn's State of Sales data shows that top-performing salespeople actually spend about 18% more time updating their CRM than average performers do Salesforce State of Sales. That clue points somewhere. It suggests some of this "non-selling" time is actually preparation that makes selling more effective, not friction that gets in its way. The real dividing line isn't selling versus non-selling. It's necessary work versus pure friction Salesforce State of Sales.
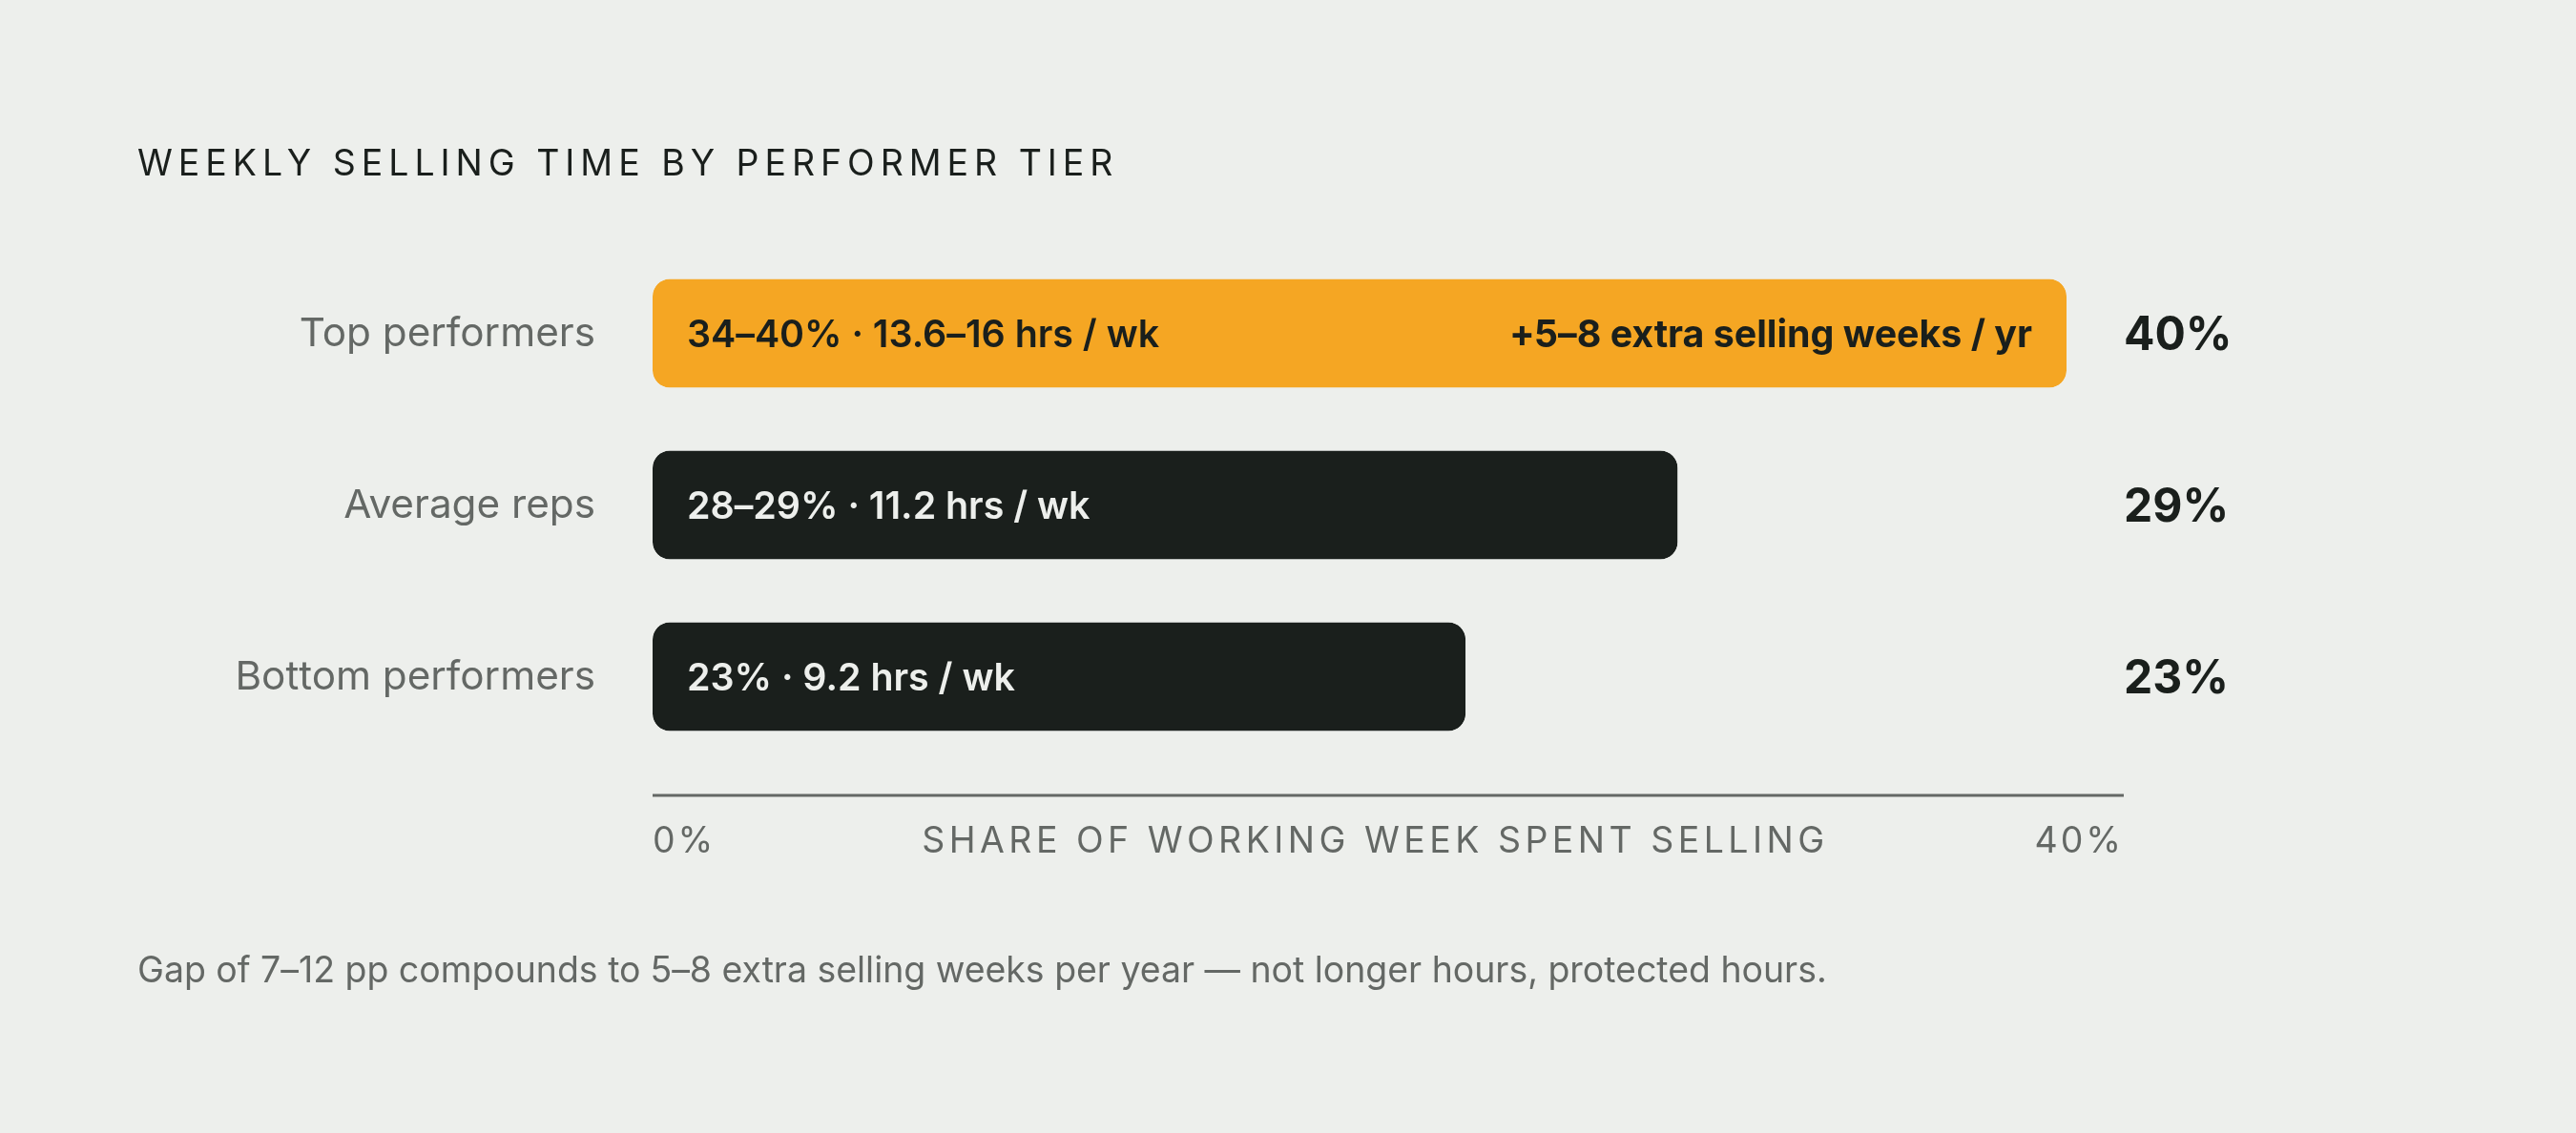
The stakes of getting that distinction right are large. Top performers spend around 34% of their time selling, while bottom performers spend only 23% landbase.com Ebsta x Pavilion GTM Benchmarks. That 7-to-12 percentage point gap works out to five to eight additional selling weeks a year for the people at the top landbase.com Ebsta x Pavilion GTM Benchmarks. So the category breakdown isn't just informative, it's a prioritization tool. Some categories, like CRM entry and research, are part of where those roughly 29 of 40 working hours go, and understanding exactly where they go is the first step to reclaiming them. Others are pure candidates for cutting or automating.
Two frameworks anchor the rest of this piece. Forrester's Activity Study tracked 3,031 reps and produced a granular, hour-by-hour breakdown of where time goes Forrester Activity Study. Salesforce and the sales analytics firm Salesmotion offer percentage-of-week breakdowns instead salesmotion.io. Both get used throughout, with their differences flagged, because they measure things slightly differently and landing on one "true" number would be misleading Forrester Activity Study.
CRM data entry: the single largest named time sink
CRM data entry shows up at the top of nearly every list. Salesforce's 2026 breakdown puts manual data entry at 17% of a rep's week, the third-largest non-selling category by share Salesforce State of Sales Salesmotion. Forrester's Activity Study, tracking actual hours across 3,031 reps, found CRM data entry and pipeline updates eat up 6.8 hours a week, the single largest block in their granular data Forrester Activity Study. Salesmotion's aggregated numbers land in the same neighborhood: 17% of a 40-hour week, with top performers cutting that down to roughly 8-10% through automation Salesforce State of Sales Forrester.
After all those hours spent typing notes into fields and updating deal stages, the majority of opportunity-related data reps gather never actually makes it into the CRM at all. The hours get spent. The information still goes missing. That's not a rounding error, that's a broken system.
There's a real irony here. CRM entry exists to create organizational value, to give managers, marketers, and future reps a reliable record of what happened with an account. But when the entry process is entirely manual, it extracts rep time without actually guaranteeing that value gets created. It's a tax with no guaranteed return.
This is why the earlier point about top performers matters so much. Remember, LinkedIn's data showed top performers update CRM more than average reps, not less. So the problem was never CRM usage itself. The problem is manual, low-automation CRM processes that create drag without producing data anyone can trust. Fix the process, not the habit.
Internal meetings: the 15% that compounds every other problem
Internal meetings show up consistently at around 15% of the average rep's week across multiple sources, which works out to roughly 6 hours on a 40-hour schedule Forrester Salesmotion. Forrester's granular tracking puts the number even higher: 7.2 hours per week, the second-largest block in the entire study, right behind CRM entry Forrester Activity Study.
What actually fills those hours? Pipeline reviews where a rep reads CRM data out loud to a room that could have just read it themselves. Forecast syncs. Standing cross-functional check-ins that happen because they're on the calendar, not because anyone needs them. One-on-ones with no structured output, no decision made, no action assigned.
Top performers don't eliminate meetings entirely, they cut their internal meeting time down to roughly 10-12% by applying the same filter they use on deals: does this meeting produce a decision, a coaching moment, or a clear next step Salesmotion? If the answer is no, it gets declined or shortened. That's a discipline, not a hack.
And this is where the category gets genuinely tricky to fix. Meetings don't just cost their own clock time, they interrupt the concentration a rep needs for good call prep or writing a sharp follow-up email, which multiplies their real cost well beyond what's on the calendar. Worse, unlike CRM entry, there's no automation trick that solves this one. Reps can't build a workflow that skips a meeting their manager scheduled. This category needs a managerial decision about meeting hygiene, not a new piece of software.
Email and inbox management: the diffuse, invisible drain
Email is where the numbers get genuinely confusing, and that confusion is itself a clue. Salesforce's 2026 breakdown puts writing emails at 22% of the non-selling workweek, the single largest category in that dataset, bigger than prospecting, bigger than data entry Salesforce State of Sales. Forrester's numbers, as cited by Landbase, put email and inbox management at a more modest 10% of the full week. Salesmotion is in between, at 14%.
Why such a wide spread? Almost certainly because these studies aren't all counting the same thing Salesmotion. Forrester's figure likely captures only reactive inbox triage, not the time spent drafting outreach or writing proposals. Forrester's own hourly tracking backs this up, showing email triage alone at 4.3 hours a week, a number that sits separately from whatever time gets spent actually composing emails Forrester Activity Study.
So which number is "right"? Probably none of them in isolation, and all of them together. The real takeaway is that email eats a meaningful chunk of every week no matter how you slice it, and that it's one of the more fixable categories on this list. Why? Because email drafting and triage are repetitive in a way meetings and relationship-building never are. The same follow-up structures. The same objection responses. Email drafting and triage are highly repetitive, pattern-based tasks (the same follow-up structures, objection responses, and scheduling exchanges), making them strong candidates for AI assistance without losing the human relationship layer.
There's also a quality trap hiding in this category. When reps are rushed, their email drafting gets generic, generic outreach gets lower reply rates, and lower reply rates create more follow-up work, which eats even more time. It's a cycle that feeds itself.
Prospect research and account preparation: the hours before a single contact is made
Before a rep ever picks up the phone or sends that first message, hours have often already disappeared into research. Forrester's data, as cited by Landbase, puts prospect research at 15% of the week, tied with internal meetings Salesmotion. The Activity Study's direct hourly tracking shows account research eating 5.5 hours a week Forrester Activity Study. Salesmotion puts the figure at 14%, and notes that top performers don't cut back on research, they get faster at it using consolidated tools Forrester.
Field data tells a related story. SPOTIO's State of Field Sales survey found field reps spend 9% of their time on prospecting research before making a single contact, with that number rising to 11% for B2B reps specifically Salesforce State of Sales Ebsta x Pavilion GTM Benchmarks. Multiplied across a week of prospecting, that adds up fast.
Part of what makes research so expensive is the sheer number of places a rep has to look. LinkedIn profiles, company websites, news articles, job postings, all pieced together by hand to build a picture of one account. At an estimated 1 to 3 hours per account, and multiple accounts to cover in a given week, research alone can eat a disproportionate share of the non-selling hours.
82% of top-performing salespeople always research before contacting a prospect, compared to just 49% of everyone else. That gap says the answer isn't to research less. The answer is to fix the fragmented, manual way research gets done.
And bad data makes all of this worse. Research from ZoomInfo and Everstage found reps spend 27.3% of their working week on tasks connected to inaccurate contact data, roughly 546 hours a year per rep spent chasing wrong numbers, bounced emails, and contacts who left the company months ago. Much of that time hides inside both the "research" and "CRM" categories, part of where those roughly 29 of 40 working hours go, and understanding exactly where they go is the first step to reclaiming them.
Scheduling and logistics: the smallest category with the most disproportionate friction
Scheduling doesn't get the headlines that email or CRM entry get, but it deserves attention precisely because of how avoidable its costs feel. Salesmotion puts scheduling and logistics at 12% of the average rep's week, nearly as large as the entire email and admin category. In raw hours against a 40-hour week, scheduling alone accounts for roughly 4.8 hours, more time than most reps spend on email triage per the Forrester tracking figure of 4.3 hours Forrester Activity Study.
What actually lives in this bucket? Coordinating calendars across time zones. Chasing down no-shows. Rebooking meetings that fell through. Sending calendar links back and forth. Confirming logistics before a demo that may or may not actually happen on schedule.
This is arguably the category where the gap between effort and value is most obvious. Calendar automation tools have existed for years, yet scheduling friction persists anyway. That persistence suggests the problem was never a lack of available solutions. It's adoption friction, tool fragmentation, or workflows that don't actually connect to where reps already work. Scheduling may be the clearest case in this whole list of a problem that gets solved not by adding a tool, but by embedding intelligence directly into the email, calendar, and CRM reps already touch every day.
Why adding more tools has not fixed the breakdown
If the answer to any of this were "buy more software," it would have been solved already. The average rep now uses roughly eight different tools just to close a deal. Gartner's survey of 1,026 sellers found that 72% feel overwhelmed by the sheer number of tools they're expected to juggle. Sellers who feel overwhelmed by their tools are 45% less likely to hit quota, according to Salesforce's data.
That's a striking finding, because it means the tool stack meant to fix the time shortage is, in aggregate, making it worse. Each individual tool probably has a defensible business case on its own. All of that is cognitive overhead, and cognitive overhead quietly cancels out whatever time savings each tool promised on its own.
SPOTIO's 2026 field sales data offers a clean structural confirmation of this pattern HubSpot Sales Trends Report Forrester. Teams with low turnover are more than twice as likely to run on just one or two systems, while high-turnover teams are three times more likely to be juggling five or more. That's a strong signal that consolidated tooling tracks with a healthier operation overall, not simply a higher tool count, though it isn't proof that fewer tools cause lower turnover. Which raises the real question for the categories already covered: the fix was never about acquiring more intelligence. It's about where that intelligence lives, and whether reps have to leave their existing workflow to find it. The mechanism is that each tool has a defensible individual ROI model, yet in aggregate, switching between systems, reconciling conflicting data across platforms, and absorbing UI updates creates cognitive load that wipes out most individual gains.
The cost of non-selling hours in quota and revenue terms
All of this eventually appears on a scoreboard, and the scoreboard isn't pretty. In 2025, 78% of sellers missed quota, up from 69% the year before, according to Ebsta x Pavilion's GTM Benchmarks Ebsta x Pavilion 2025 GTM Benchmarks. That's a meaningful jump in one year, and it lines up neatly with everything covered so far. Quotas were generally set assuming reps had close to full selling capacity. They don't, and the gap between assumption and reality keeps widening.
The revenue is also wildly concentrated. Ebsta x Pavilion's analysis of 655,000 opportunities found that just 14% of sellers drive 80% of revenue, an 11x performance gap between the top tier and everyone else Salesmotion. That gap tracks directly with how much selling time each group actually protects. Top performers spend 35-40% of their week actively selling, the average rep spends 28%, and bottom performers spend just 23% Salesforce State of Sales Salesmotion landbase.com.
At a team level, the numbers get even harder to ignore. SPOTIO's data shows field reps lose about 21% of their time, roughly 8 hours a week, to admin. Across a team of just 10 reps, that adds up to more than 4,400 hours a year spent on tasks that never move a single deal forward.
A slower, quieter cost also builds from all of this, showing up as reps burning out, burnout driving attrition, and attrition meaning replacing a rep and waiting through a multi-month ramp. Reps who are acutely aware that most of their week goes to non-revenue work tend to burn out. Burnout drives attrition. Attrition means replacing a rep and waiting through a multi-month ramp, estimated at 6 to 12 months to reach full productivity. Which means the original time problem doesn't just persist, it compounds every single quarter a company fails to address it. The 7–12 percentage-point difference between top and average performers adds up to five to eight additional selling weeks per year, not from working more hours but from protecting the hours that exist.
The time breakdown when AI is embedded in existing workflows
AI isn't one lever that fixes all of this at once. Its impact shifts sharply depending on which category it touches, and the research is fairly clear on one point: the biggest gains occur when AI runs inside the tools reps already use, the inbox, the CRM, the calendar, rather than asking reps to open yet another app.
Take email. Sellers using AI agents expect a 36% reduction in drafting time, according to Salesforce's report Salesforce State of Sales landbase.com. Tools that draft replies and log follow-ups directly inside the inbox, without reps needing to learn prompt engineering, go straight after that 22% email share identified in Salesforce's breakdown Salesforce State of Sales landbase.com.
CRM entry follows a similar logic. Activity capture built directly into the CRM a team already uses can eliminate the manual logging Forrester clocked at 6.8 hours a week Salesforce State of Sales Forrester Activity Study. And this isn't theoretical. Top performers already show the number can drop to 8-10% of the week, down from the 17% average, when the process gets automated well Salesforce State of Sales Forrester Activity Study Forrester.
Research shows comparable gains. Sellers using AI agents expect a 34% reduction in research time, and the mechanism matters here as much as the number landbase.com.
Scheduling might be the most straightforward win of all. The 12% of the week currently lost to logistics is a strong target for automation, but only when that automation lives inside the calendar and email workflows reps already use, not in a separate app that adds one more login to remember Salesmotion.
The broader survey data backs up the pattern. HubSpot's report found 84% of sales professionals using AI say it saves time and makes their process smoother, with most saving somewhere between one and five hours a week. That's a wide range, and it should be treated that way. The outcome depends heavily on how deeply the AI is actually integrated into a rep's daily workflow, not just whether a company bought the license HubSpot Sales Trends Report Forrester.